The world of trading is brimming with patterns and indicators that promise to unlock the secrets of market movements. Among these, the Bullish Marubozu stands out as a beacon of bullish momentum.
This blog post delves deep into the heart of the Bullish Marubozu candlestick pattern, exploring its fundamental concepts, identifying characteristics, and practical trading strategies.
1. What is a Bullish Marubozu?
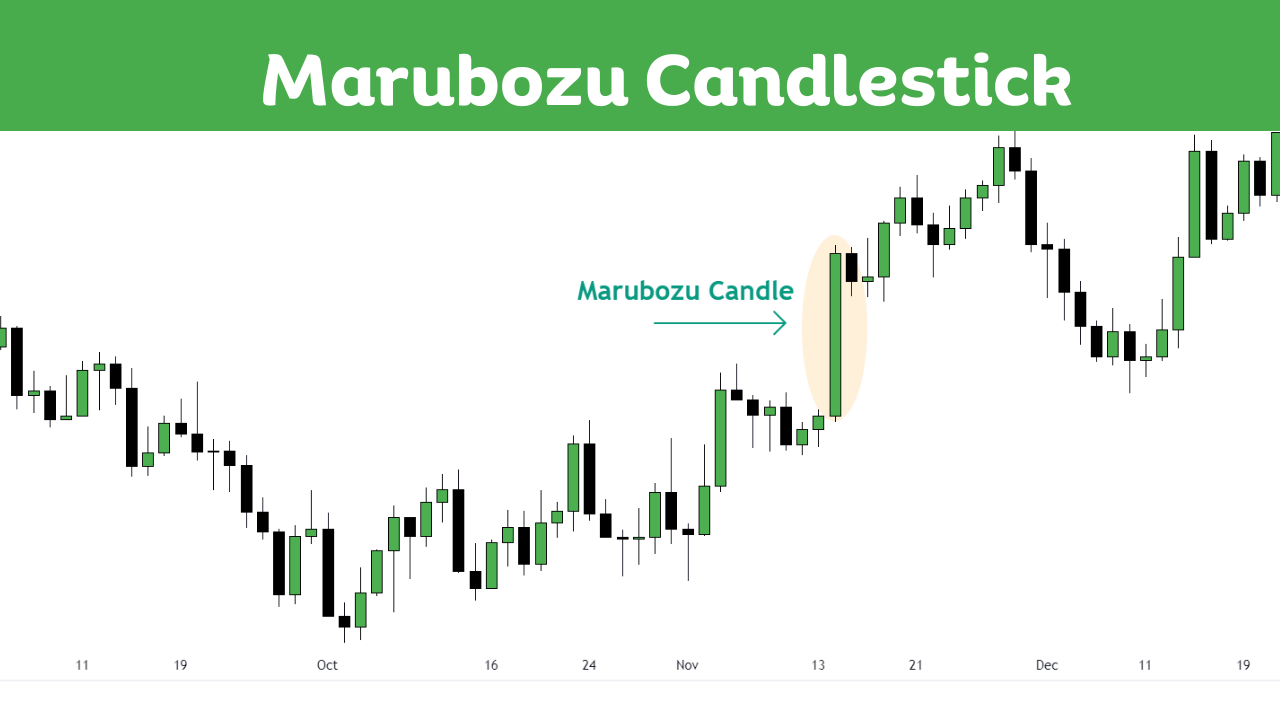
The Bullish Marubozu is a candlestick pattern, primarily recognized for its potent bullish signal. It’s characterized by a long body with minimal or no wicks (shadows) at either end. The pattern conveys a clear message: during the trading period, buyers were in unwavering control.
Key Characteristics:
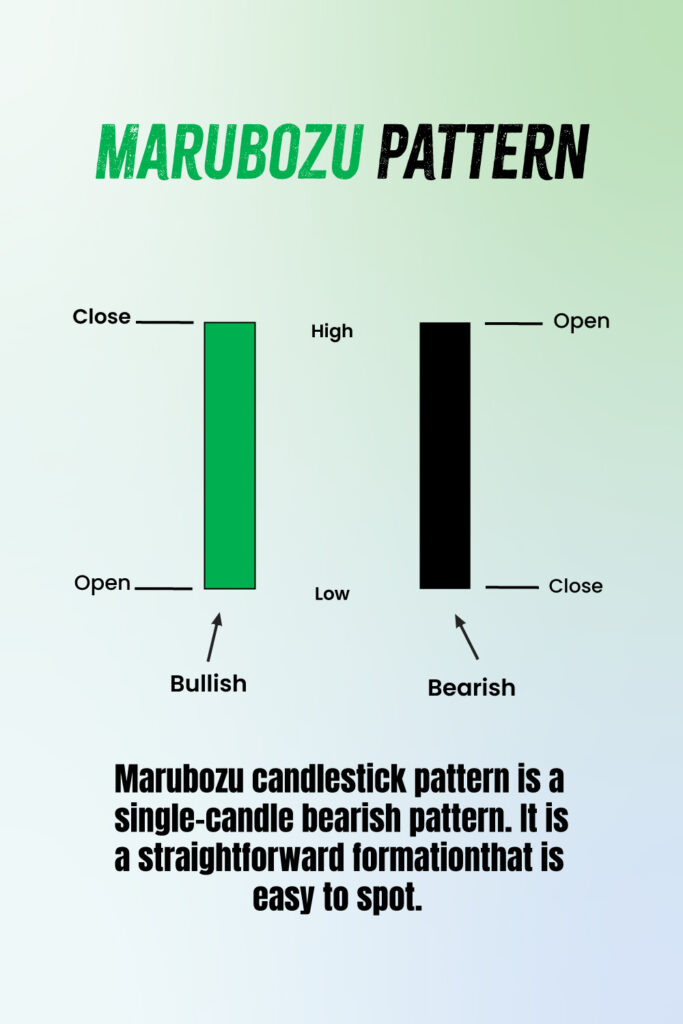
- Opening and Closing Prices: The candle opens at or near its low and closes at or near its high.
- Body Length: It has a long body, indicating a significant price increase from open to close.
- Shadows: Ideally, the Bullish Marubozu lacks shadows. If present, they are extremely short, implying that the open and close are very close to the period’s high and low.
- Color: Typically represented in green or white, signifying that the closing price was higher than the opening price.
2. The Formula Behind the Bullish Marubozu
The Bullish Marubozu can be distilled into a simple formula:
- Open ≈ Low
- Close ≈ High
- Body = Close – Open (a large positive number)
- Upper Shadow = Negligible or Zero
- Lower Shadow = Negligible or Zero
3. Market Implications of the Bullish Marubozu
When a Bullish Marubozu appears, it indicates that buyers dominated the trading session from start to finish. This dominance suggests a strong bullish sentiment and can often signal:
- Continuation: In an uptrend, it can signify the persistence of bullish momentum.
- Reversal: In a downtrend, it may hint at a potential reversal, as the bears lose their grip.
Trading Strategies Involving the Bullish Marubozu
Entry Points:
- In a downtrend, a Bullish Marubozu may serve as a reversal signal. Consider entering a long position at or near the close of the Marubozu.
- During an uptrend, use the appearance of the Marubozu to reinforce your confidence in maintaining or entering new long positions.
Exit Points and Stop-Loss Considerations:
- Set a stop-loss just below the low of the Bullish Marubozu to protect against sudden reversals.
- Monitor the following candles. If bearish patterns emerge, consider taking profits and exiting your position.
Example of Bullish Marubozu Candle Pattern
The below image show the formation of Bullish Maubozu on EURUSD Pair
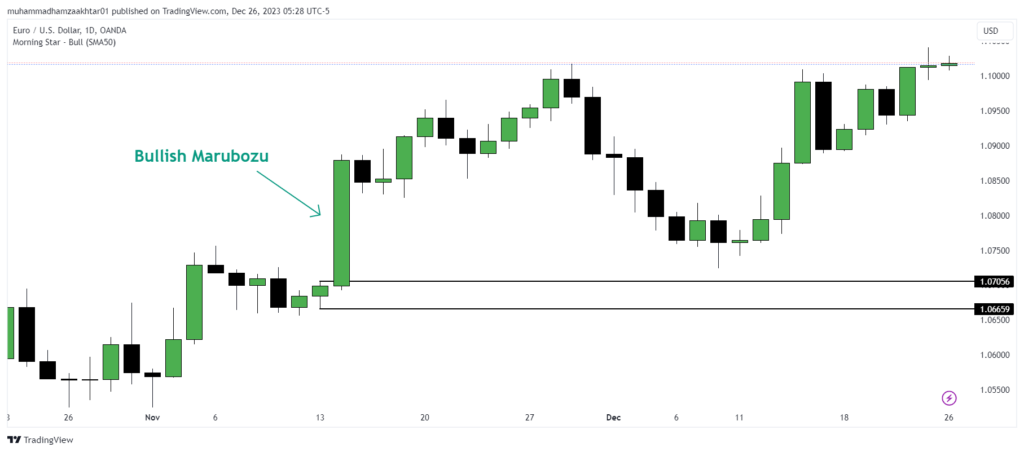
The below image show my long trade on the EUR/USD pair, a long position is initiated using the Marubozu candlestick pattern on a daily chart.
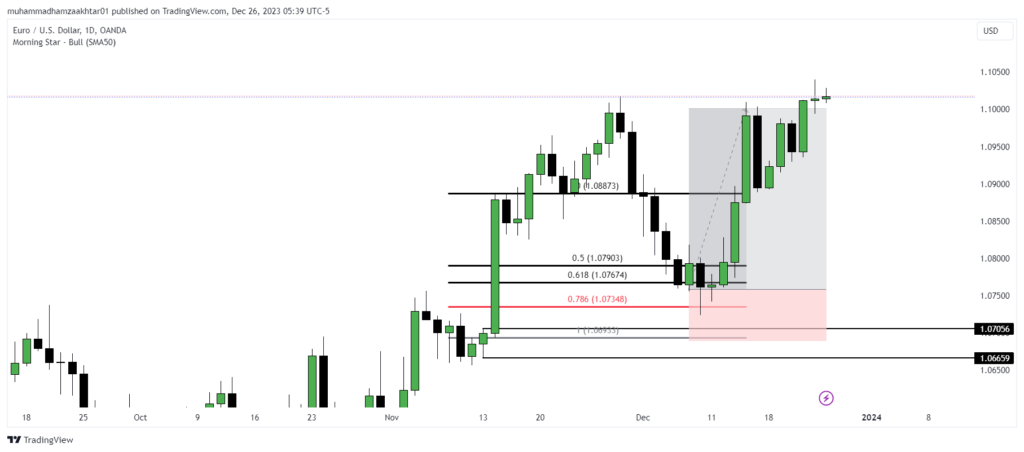
The entry point is set at 1.07566, aligning with the 78% Fibonacci retracement level of the Marubozu candlestick.
The stop loss is strategically placed at 1.06960, the low of the Marubozu candle, to mitigate potential losses. The take profit target is also set at 1.06960 and is achieved on December 14, 2023.
This strategy highlights the effective use of Fibonacci retracement for entry and the importance of well-placed stop loss and take profit levels in forex trading.
5. Critical Considerations and Risk Management
While the Bullish Marubozu is a powerful indicator, it’s vital to consider it within the broader market context. Always corroborate its signals with other technical analysis tools and indicators. Be aware of market news and events that might influence price action.
- Dark Cloud Cover: A Guide to Trading This Bearish Candlestick Pattern - 26 December 2023
- Title: Piercing the Veil of Market Sentiment: The Piercing Pattern in Trading - 26 December 2023
- Bullish Marubozu: A Comprehensive Guide to Trading with Confidence - 26 December 2023