In the fast-paced world of financial markets, where every decision can lead to profit or loss, having a strategic edge is invaluable.
One such edge that price action traders often leverage is the concept of Fair Value Gaps (FVGs). In this blog post, we’ll explore what Fair Value Gaps are, why they matter, and how traders can harness them to build a powerful trading strategy.
What are Fair Value Gaps (FVGs) in Trading
Fair value Gaps or FVG are the inner circle trader (ICT) trading concepts. According to him, Fair Value Gaps can be defined as an inefficiency in the delivery of price.
Learn more about ICT Fair Value Gap Interpretation.
Fair Value Gaps are anomalies in the market, signaling imbalances between buying and selling forces. These gaps manifest in a three-candle sequence on price charts, creating a distinctive pattern.
The psychology behind the fair value gap is that these gaps emerge due to inefficient price delivery.
The market returns to fill these gaps, presenting a valuable opportunity for Forex traders to execute their trades aligned with the movements of market makers or smart money.
Types of Fair Value Gaps
There are two types of fair value gap bullish and bearish FVG.
Bullish FVG
A bullish Fair Value Gap (FVG) forms when the market undergoes a dramatic shift from bearish to bullish, often with aggressive movements. This aggressive move breaks through previous key levels (lower highs) established during the bearish phase.
Without a change in market structure, the formation of a fair value gap is less reliable and not use FVG as a trading signal.
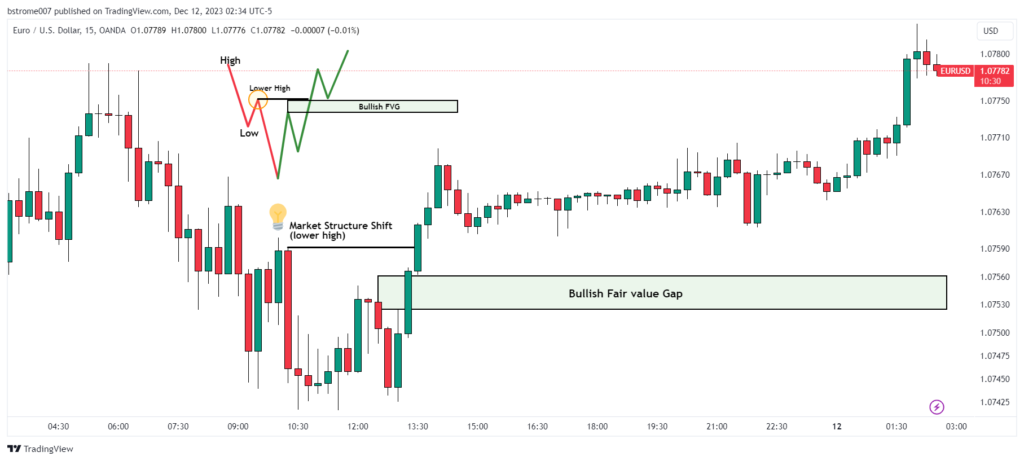
The EURUSD chart above illustrates the creation of a bullish fair value gap on December 12, 2023, at a 15-minute time frame. The chart indicates a shift in the market, marked by aggressive price movements transitioning from bearish to bullish, resulting in the formation of a bullish fair value gap or FVG.
Bearish Fair Value gap
In a similar vein, a bearish fair value gap (FVG) takes shape when the market experiences a significant shift from a bullish to a bearish state, typically accompanied by aggressive movements. This breaches prior crucial levels, such as higher lows established during the bullish phase.
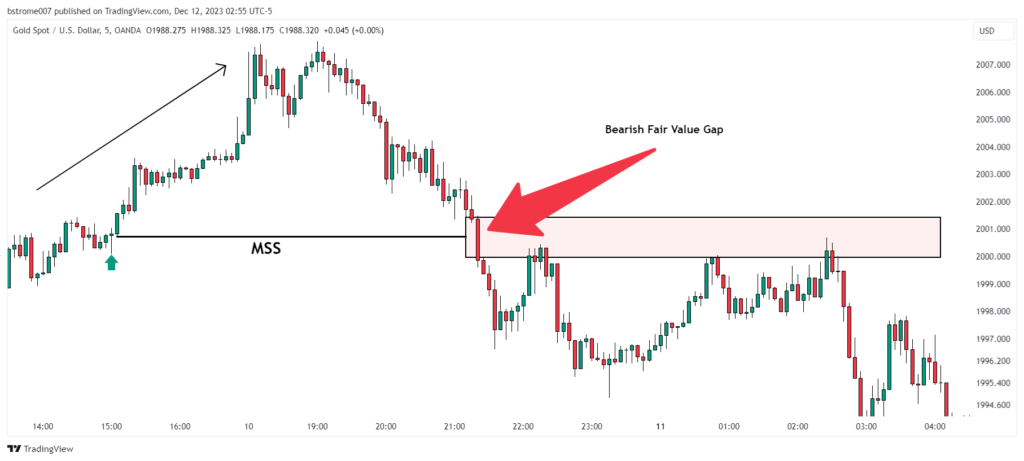
The XAUUSD (Gold/US Dollar) chart above reveals a bearish fair value gap on December 10, 2023, in a 5-minute time frame.
How to Find Fair Value Gap (FVG)
For finding a fair value gap or valid FVG find the steps explained below.
Market Structure Shif(MSS)
To identify a valid Fair Value Gap (FVG), the initial step is to detect a shift in market structure. This shift in market structure signifies a change in market sentiment, transitioning from bullish to bearish or vice versa.
Most of the time this market structure shift (MSS) is found near supply and demand zones.
. Big Candlestick with Large Body:
- Imagine a tall candle on your price chart, like a skyscraper compared to its neighbors. This is the first sign of a potential FVG.
2. Body vs. Wick Ratio:
- Look at the ratio of the candle’s body to its wicks (the thin lines above and below). Aim for a body size of around 70% or more compared to the wicks. A thick body indicates significant price movement.
3. Gap Above or Below Previous Candles:
- Now, check if the tall candle’s body creates a gap above or below the previous candles’ bodies. This gap represents a price range where no trading occurred, potentially hinting at a shift in market sentiment.
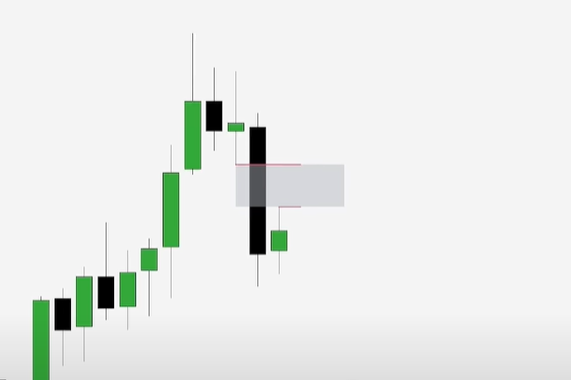
Checking Nearby Candlesticks:
Once you find the big candlestick, check the ones just before and after it. They shouldn’t fully cover the big one, but small overlaps are okay on the top and bottom. The fair value gap is the gap between the wicks of these nearby candlesticks.
Fair Value Gap Trading Strategy
Improving the text for clarity and coherence:
Trading a fair value gap involves more than simply identifying a three-candlestick pattern with a gap in the middle candle. It requires additional confluence factors for a comprehensive analysis. In the next section of this blog post, I will delve into the application of the ICT 2022 mentorship model to effectively navigate and trade fair value gaps.
ICT FVG Trading Strategy Component
- Time
- MSS
- Liquidity
ICT Kill Zones
Identifying Fair Value Gaps (FVGs) within specific time windows during major forex trading sessions, which ICT calls “kill zones,” is crucial. Pay attention to price action within the first 1-2 hours after the opening of both the London and New York sessions.
To delve deeper into these specific time windows, visit the official Inner Circle Trader website or refer to the detailed insights provided in this article.
Liquidity Sweep
Understanding market dynamics during ICT’s kill zones is crucial for informed trading decisions. Price action in these periods can be influenced by significant order flow, potentially impacting where liquidity resides.
By analyzing market context and observing price movements, traders can navigate these specific time intervals with greater awareness and manage their risk effectively.
Market Structure Shift (MSS)
The term “shift in market structure” denotes a change in market direction, transitioning either from a bullish to bearish sentiment or vice versa — essentially capturing the shift from an upward to a downward trend or from a downward to an upward trend.
If a fair value gap is formed after the Market Structure Shiftt (MSS) or a liquidity sweep within the ICT kill zones, it provides a high-probability trading setup that can significantly elevate your win rate.
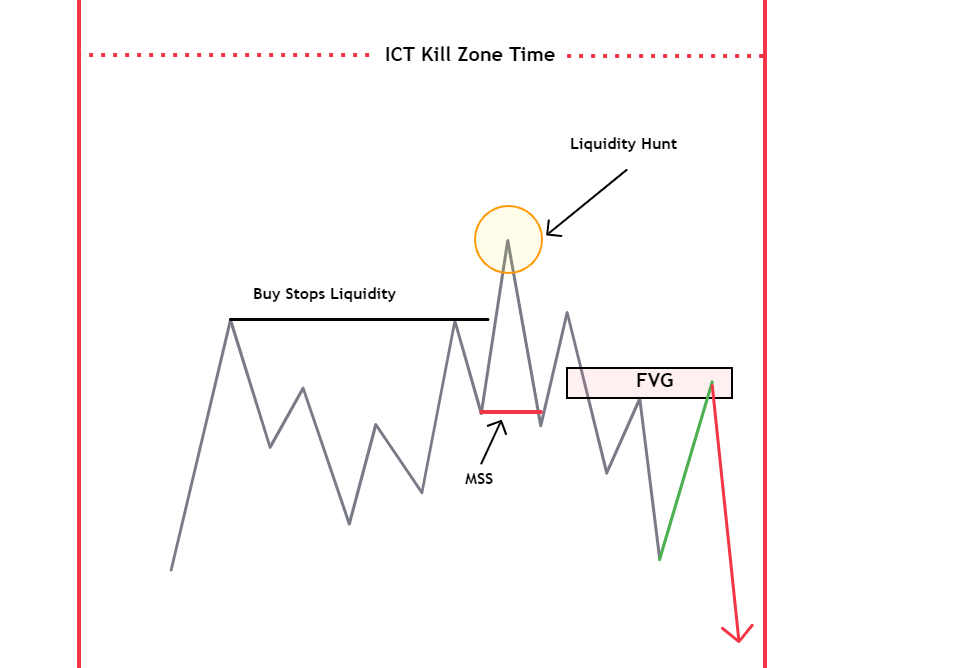
The diagram above illustrates the comprehensive model for trading Fair Value Gaps, combining all essential components, including time considerations, liquidity, stop-loss hunts, market structure shifts, and the Fair Value Gap itself.
This diagram is based on the ICT 2022 trading model.
- Dark Cloud Cover: A Guide to Trading This Bearish Candlestick Pattern - 26 December 2023
- Title: Piercing the Veil of Market Sentiment: The Piercing Pattern in Trading - 26 December 2023
- Bullish Marubozu: A Comprehensive Guide to Trading with Confidence - 26 December 2023