Imagine this: You’re analyzing a stock chart and notice an unusual candlestick formation at the end of an uptrend. It’s called the Hanging Man pattern.
But what does it mean? Is it a sign of a potential market shift?
Let’s uncover the secrets of the Hanging Man pattern and see how it can be used in your trading strategy.
What is the Hanging Man Candlestick Pattern?
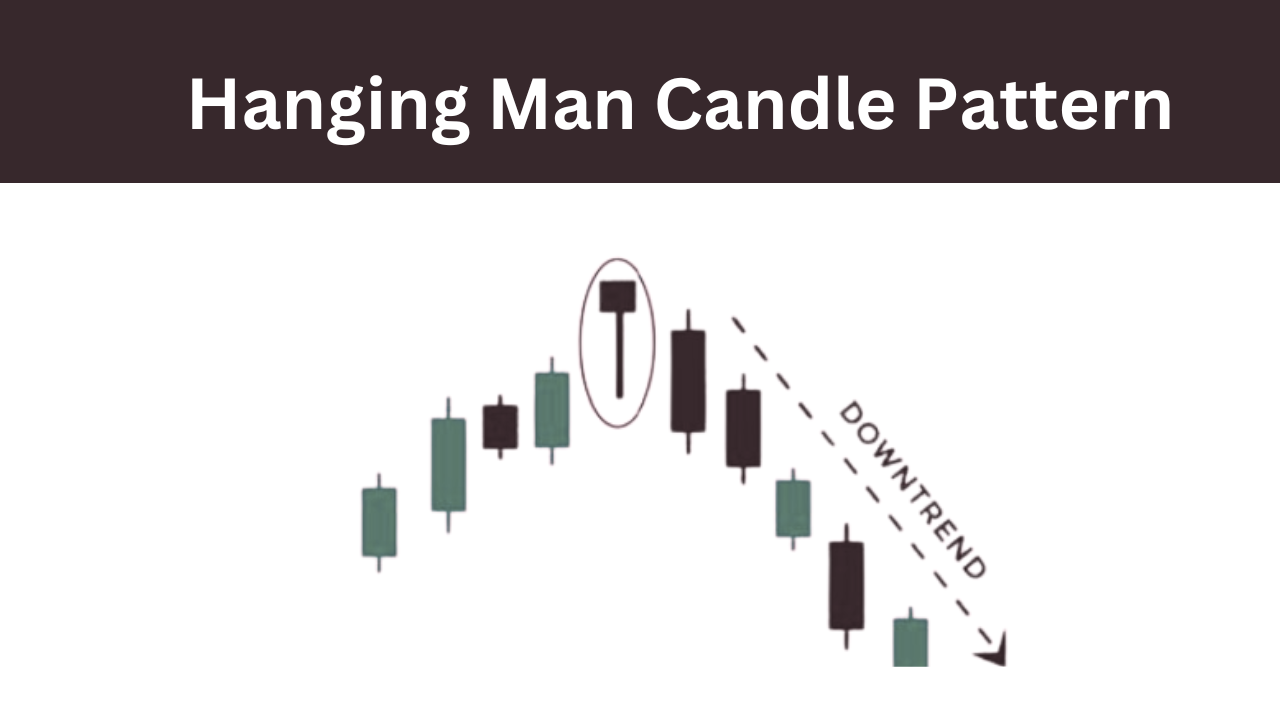
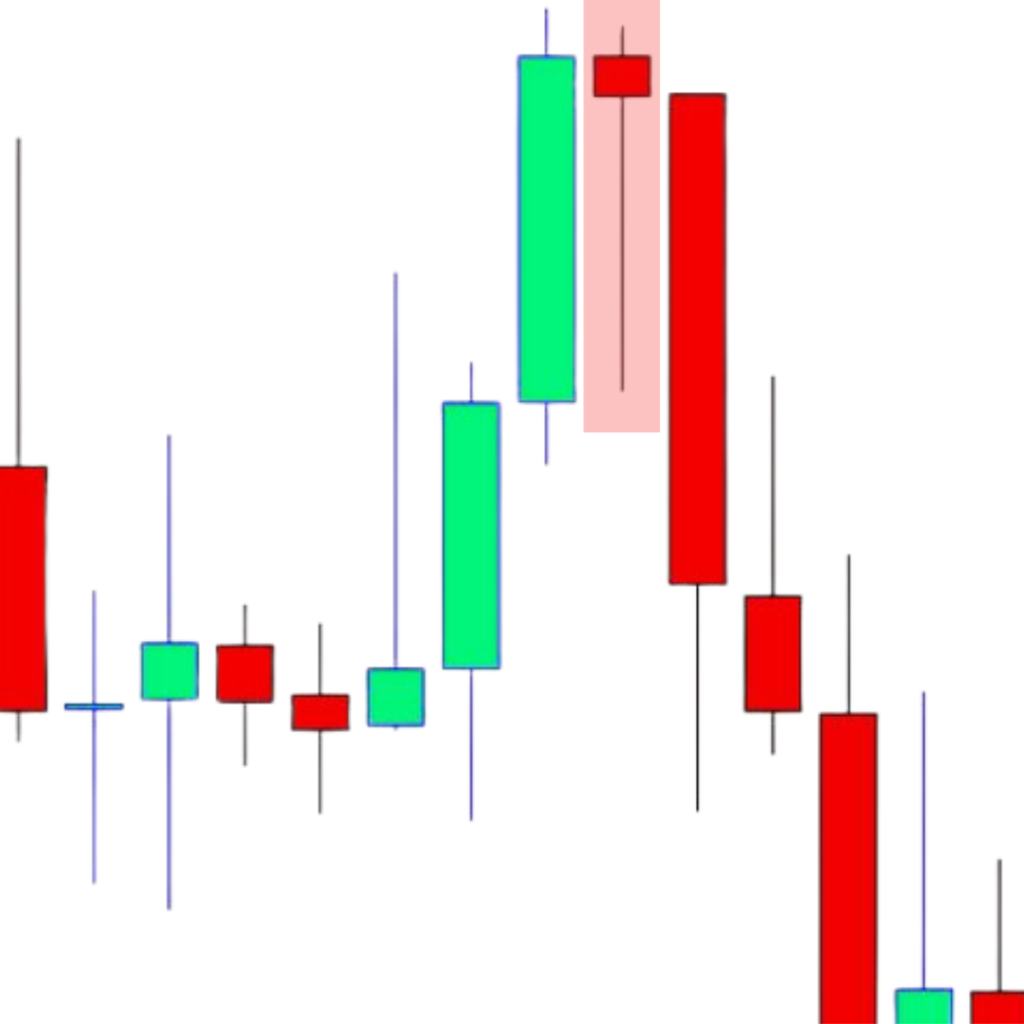
The Hanging Man candlestick pattern is a potential bearish reversal indicator that typically emerges at the peak of an uptrend.
This pattern is named for its resemblance to a hanging figure with a small upper body and a long lower shadow.
But why should you care? Recognizing a Hanging Man can be crucial in anticipating a possible shift from a bullish to a bearish market trend.
Anatomy and Definition of the Hanging Man Pattern
Understanding the definition of the Hanging Man is key to identifying it accurately. It features a small body at the upper end of the trading range with a long lower shadow that’s at least twice the length of the body.
The small or nonexistent upper shadow completes this pattern. This formation suggests a battle where buyers lost their grip, and sellers began to take control, indicating potential downward momentum.
Key Points to Remember
- Where to Find: The Hanging Man is found at the top of an uptrend.
- Wait for the Next Candle: It’s crucial to wait for confirmation from the following candle to validate the pattern.
- Higher Time Frame Direction: Confirm the pattern with the prevailing trend in a higher time frame for added reliability.
- Money Management: Implementing effective money management tactics is essential in trading.
- Risk Management: Always have a clear understanding and plan for managing your trading risks.
- Use a Stop Loss: A stop loss is vital to protect your trade from unexpected market reversals.
- Control Lot Size: Managing your lot size helps maintain a balance between risk and potential returns.
How to Trade Hanging Man Candlestick Patterns: Complete Strategy
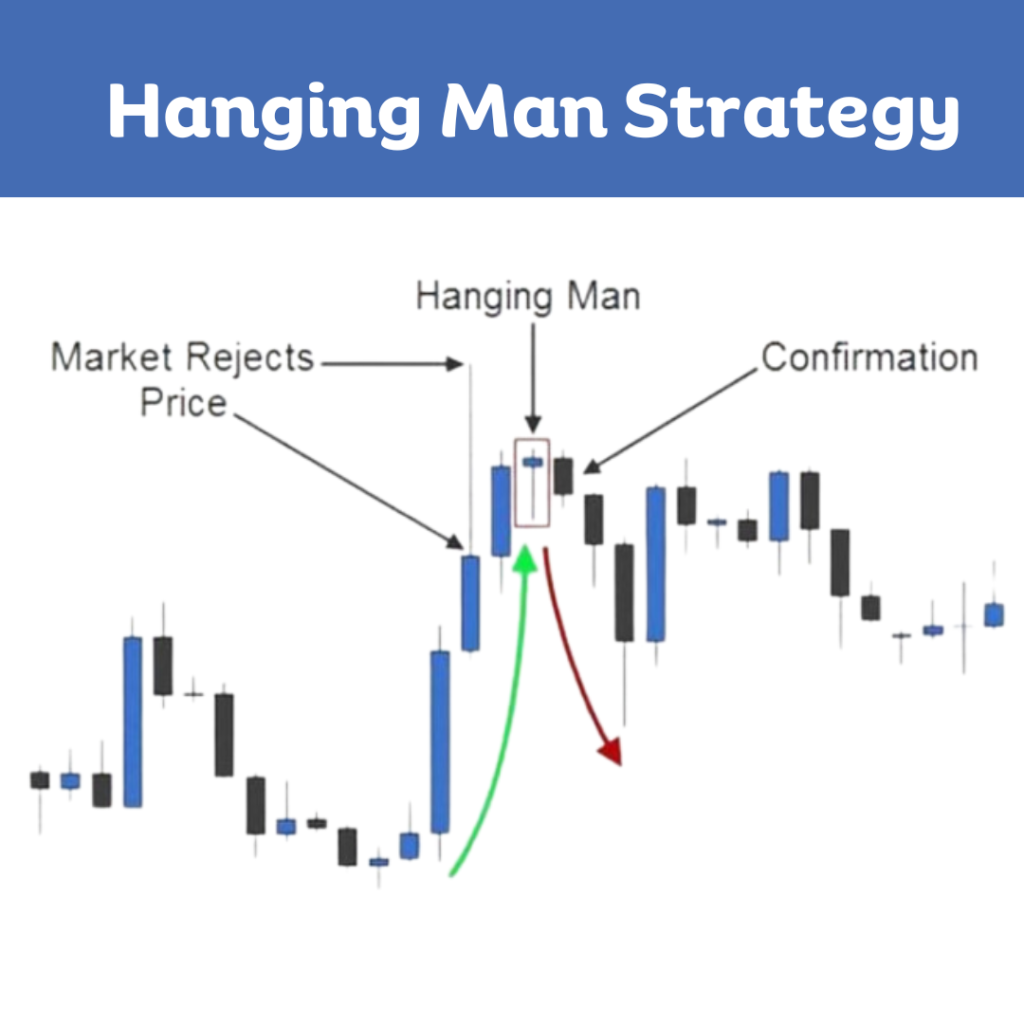
Where to Find
The first step is spotting the Hanging Man pattern at the end of an uptrend. Context is crucial; this pattern is significant when it appears after a price increase.
Entry Point
Entering a trade after a Hanging Man pattern requires confirmation. Typically, this would be a subsequent bearish candlestick closing below the Hanging Man’s low, confirming the downward trend.
Stop Loss Placement
Your stop loss should be strategically placed above the high of the Hanging Man. This minimizes potential loss if the expected downward trend doesn’t materialize.
Take Profit
Setting a take profit target depends on the existing market structure. A common strategy is to aim for the next significant support level or use a fixed risk-reward ratio.
Risk-to-Reward Ratio
Choose a risk-to-reward ratio that aligns with your overall trading strategy. A ratio of 1:2 or higher is often recommended, but this can vary based on individual trading style and market analysis.
Conclusion
In the world of trading, the Hanging Man candlestick pattern serves as a critical tool for spotting potential bearish reversals.
Remember, this pattern, like all technical indicators, is not a silver bullet. It should be used in conjunction with other analysis methods and sound trading principles, including robust money and risk management techniques.
As you continue your trading journey, always be ready to adapt and learn, keeping in mind that each pattern is a piece of the larger market puzzle.
Want to explore more? Read our detailed analysis of the Hammer Candlestick Pattern and expand your trading knowledge!
What’s been your experience with the Hanging Man pattern? Share your stories or questions in the comments below – let’s learn from each other’s trading journeys!
- Dark Cloud Cover: A Guide to Trading This Bearish Candlestick Pattern - 26 December 2023
- Title: Piercing the Veil of Market Sentiment: The Piercing Pattern in Trading - 26 December 2023
- Bullish Marubozu: A Comprehensive Guide to Trading with Confidence - 26 December 2023