Order blocks are specific price areas on a chart where large market participants, such as banks and other institutional traders, have placed large orders.
These orders can have a significant impact on price movement, and by understanding where order blocks are located, retail traders can increase their chances of success.
What is Order Block in Forex Trading?
In Forex trading Order blocks are formed when market participants place buy or sell orders at a specific price level. These orders are then accumulated over time, creating a large pool of liquidity at that price. When the price reaches the level of an order block, it can be met with strong buying or selling pressure, depending on the type of order block.
- Bullish OB
- Bearish OB
ICT Bullish Order Block(OB)
ICT Bullish Order Blocks in trading is defined as a last down closing candle or a series of down closing candles before the price moves upward, causing the break of structure .
The price rises substantially as a result of an accumulation order from institutional traders.
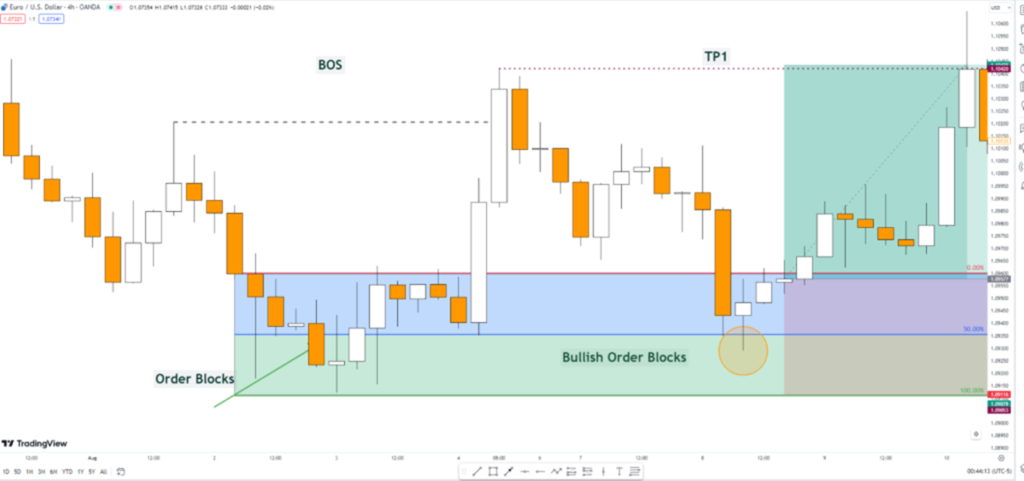
The above chart show the ICT Bullish OB in EURUSD. When price reach this OB moves in Upward direction .
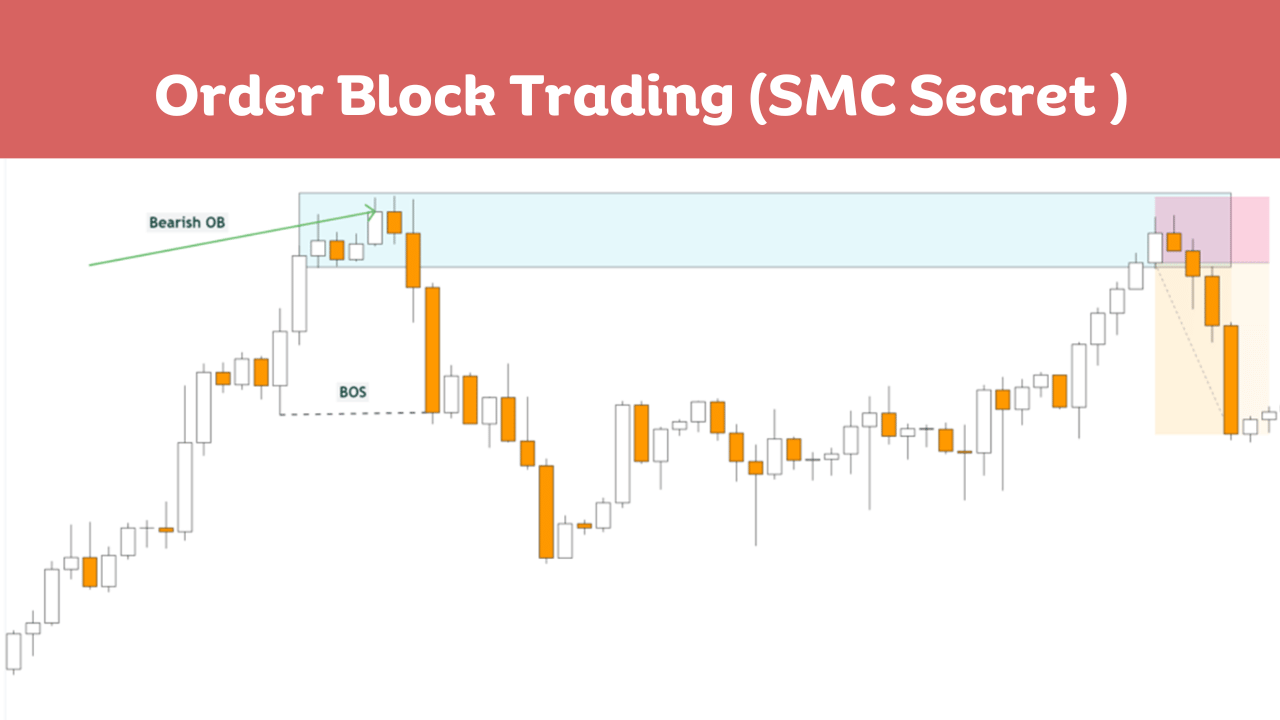
ICT Bearish Order Block(OB)
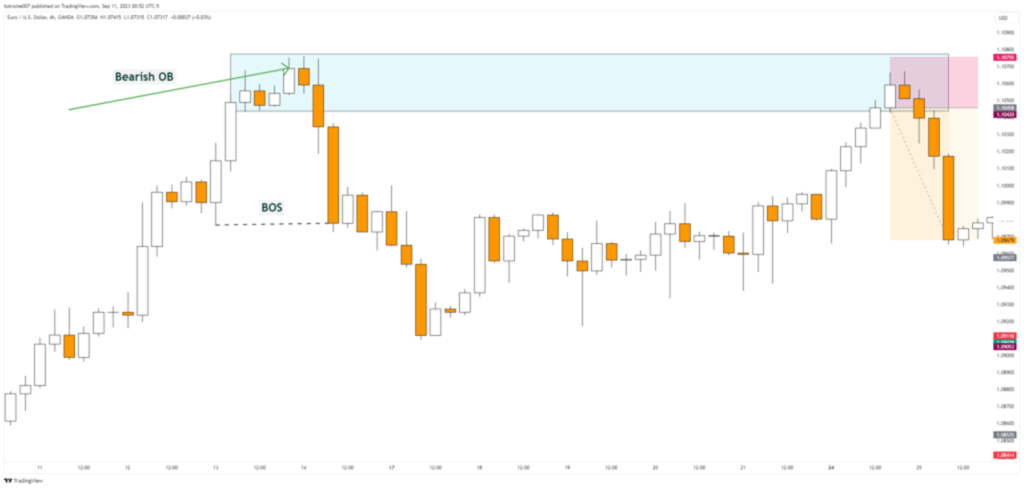
Bearish Order Blocks can be defined as a last up-close candle or a series of up closing candle before the price rapidly moves in downward direction.
How to Identify Them in Forex Trading
To find an Order Block in the forex market, you need a good understanding of how forex works. When you look at a chart, you’ll notice lots of candles going up and down before the price suddenly shoots up this can be confusing.
You must consider these 3 key factor when trying to find and order block in forex
- Consolidation
- Aggressive price movement
- Break of Structure
1. Consolidation:
Look for areas of consolidation or tight price ranges where the market alternates between upward and downward movements, resembling support and resistance zones. These areas often attract orders from market participants.
2.Sharp Price Movements:
Identify regions where prices exhibit aggressive movements. These sharp movements are typically driven by large institutional orders, indicating significant market interest.
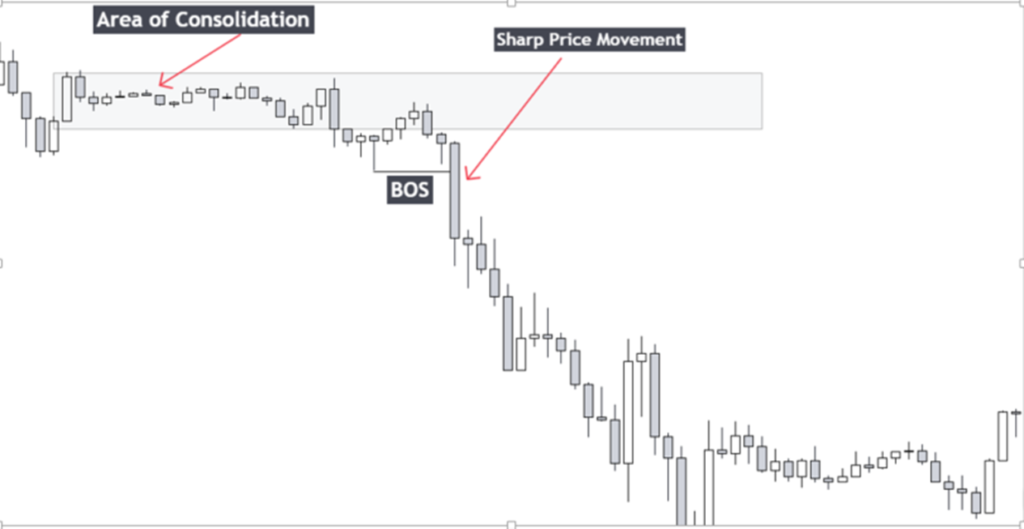
3. Break of Market Structure:
To validate an order block, it’s essential that the sharp or rapid price movement breaks the existing market structure. In a bullish scenario, this means surpassing the previous higher high (HH), while in a bearish scenario, it involves breaching the prior lower low (LL). This structural break signifies a potential order block.
By considering these three factors in combination, you can better identify order blocks within the market.
ICT Order Block Trading Strategy
Trading the order block required patience, back testing and strong emotions and risk management skills.
Key Component of Order Block Trading Strategy
Identify Key Levels
To avoid confusion, focus on specific key levels when looking for order blocks. These levels include the lows and highs of different trading sessions:
Asian Session: Pay attention to the low and high of this session.
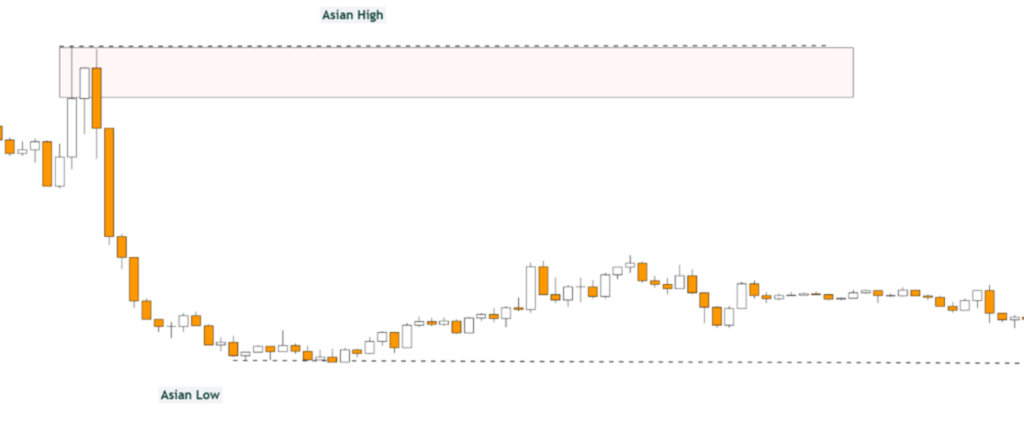
above chart show the bearish OB on Asian High
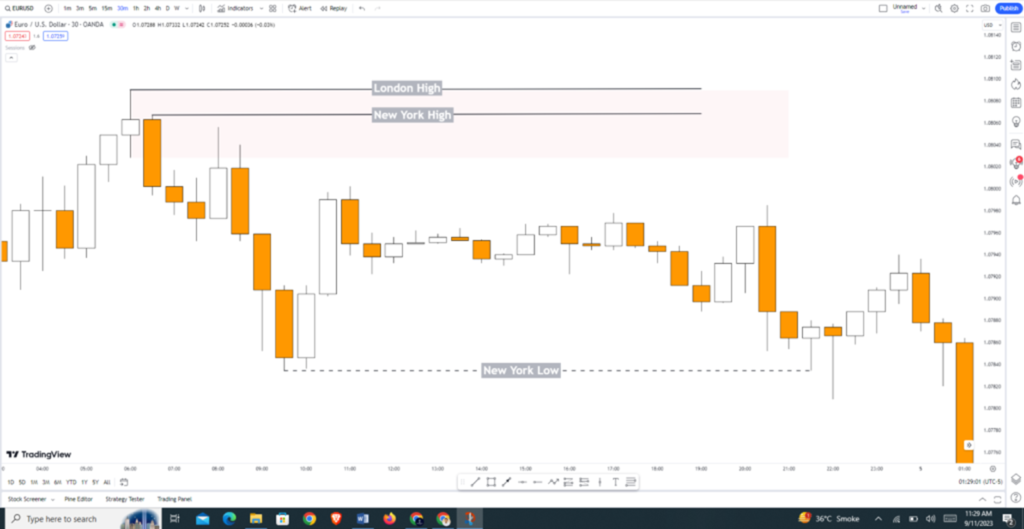
London and New York Session: Similarly, monitor the low and high of these sessions.
These levels are significant because they are often where market makers or smart money participants enter or exit the market.
Trade in Kill Zones
Find trading setup in a specific time zones known as ICT Kill Zones. These zones are specific time periods during the day when the likelihood of high-quality trading setups is higher. Trading during these times can help you increase your chances of success.
Learn more about ICT Kill Zones Timing
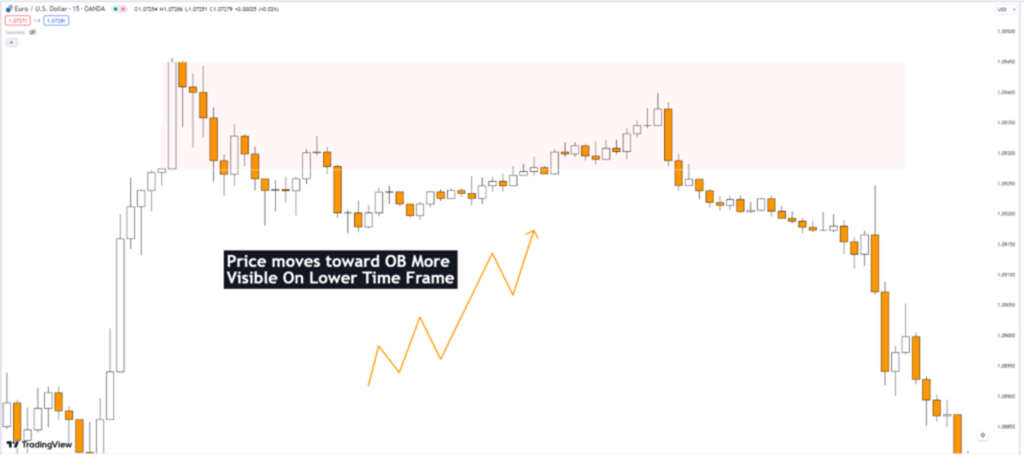
Lower Time Frames
Wait for the market to return to lower time frames to execute their pending orders. This approach allows you to take advantage of price movements as they interact with previously established levels.
Find Market Structure Shift (MSS)
After the execution of pending order wait for the market structure shift. Basically MSS is reversal signature that confirm that market is rea
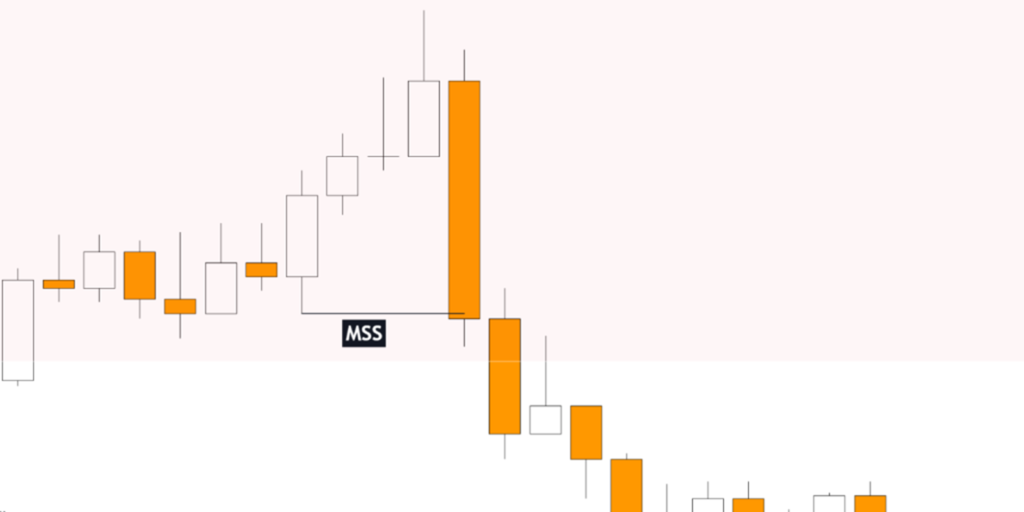
above chart show in shift in market structure(MSS) some tome called break of structure(BOS) or Change of character (CHOCH).
When the price reaches an order block (OB), it can experience a shift in trend. This is because the OB is a level where there are a large number of pending orders that were not executed when the market makers first placed them. Smart money traders often come back to these levels to execute their orders, which can cause the price to reverse direction.
Enter on Fair Value Gap (FVG):
Plan your entry based on the Fair Value Gap, which is a three-candlestick pattern indicating an inefficient price delivery. By recognizing FVG patterns, you can identify potential trading opportunities.
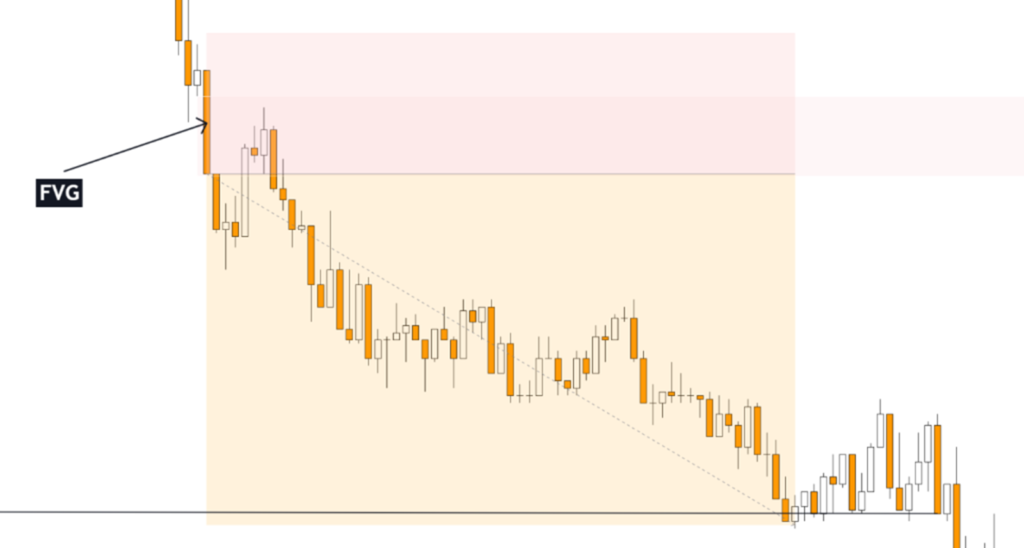
Learn more about FVG in Crypto
Order Block Risk Management
- Manage your risk before you take trade on the base of order block. Some important consideration when trading Order Block
- Enter at 50% fib levels of the OB
- Use Small Lot Size
- Use Small lot size
Order block example forex
Order Block is work in any stock forex, crypto
In this section we discuss some examples of order block in EURUSD,XAUUSD,JPYUSD Pairs
EURUSD Example
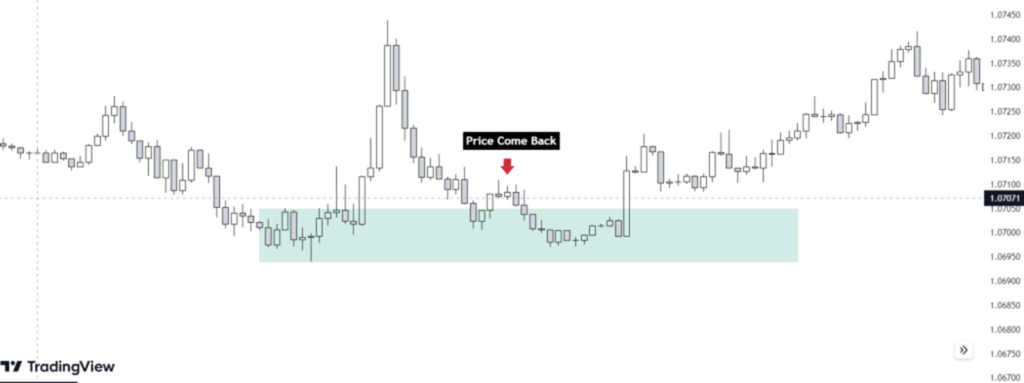
EURUSD have an bullish order block price come back to execute the pending orders and moves in upward direction.
XAUUSD Example

The preceding order block example illustrates a Bullish OB in the gold market. When the market retraces due to the accumulation of buying orders, the price is expected to resume its upward trajectory.
Order Block Example In Crypto
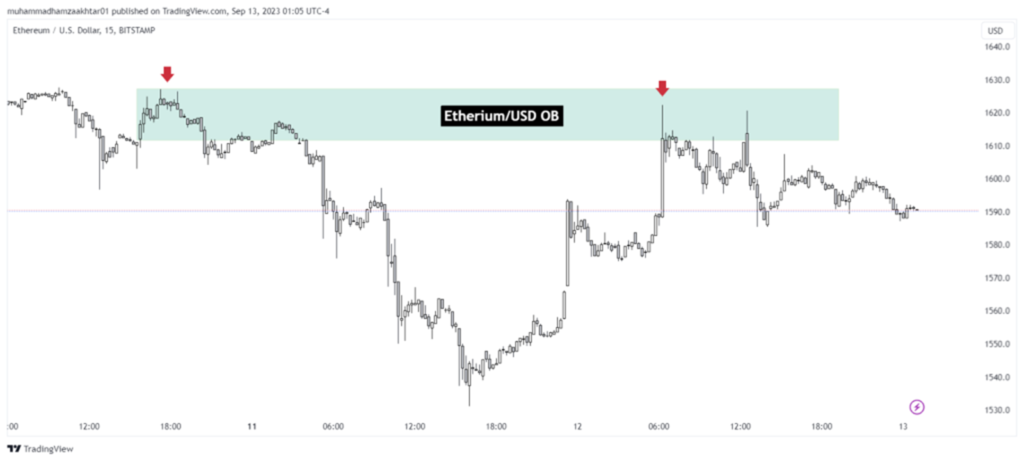
Above chart show Bearish Order Block in EthereumUSD .
From above order block examples it is clear that Order Blocks concept is worked in both fx or crypto market.
Best time frame for order block
Order Blocks can be find on any time frame but you need top down analysis and find it on higher time frame.
Order Block Trading Strategy With Time
Begin your analysis with a top-down approach, which involves examining the daily chart. This approach eliminates chart noise and provides a clear market perspective, aiding in the formation of a daily bias.
Once you have established your daily bias, transition to the 1-hour time frame to identify trading opportunities in alignment with your daily bias.
For trades based on the concept of order blocks, consider entering on the 15-minute time frame.
If you require additional confirmation, you can utilize the 5-minute, 3-minute, and 1-minute time frames to identify Fair Value Gaps (FVG) and make entries based on this confluence.
- Dark Cloud Cover: A Guide to Trading This Bearish Candlestick Pattern - 26 December 2023
- Title: Piercing the Veil of Market Sentiment: The Piercing Pattern in Trading - 26 December 2023
- Bullish Marubozu: A Comprehensive Guide to Trading with Confidence - 26 December 2023