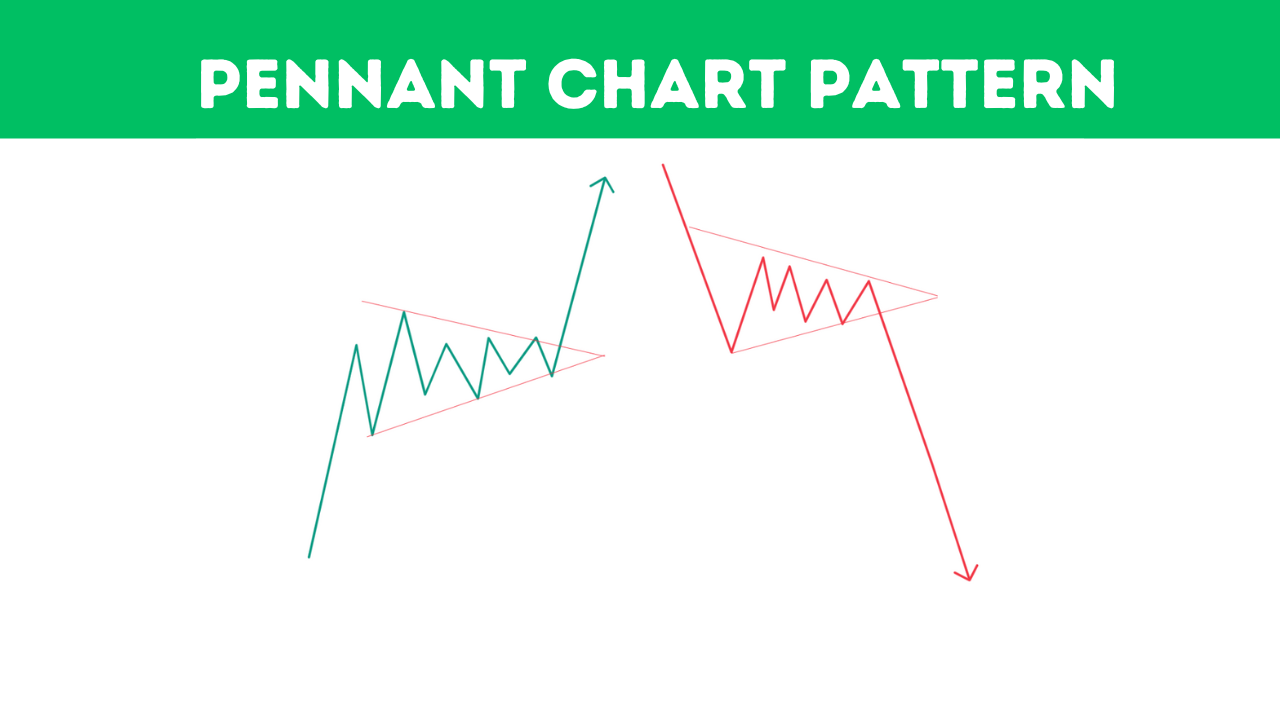
A pennant is a continuation pattern that occurs after a strong move in the price of a security. It is characterized by converging trendlines that form a triangular shape, resembling a flag with a tapering end.
Pennants are typically formed during periods of consolidation when the price is trading in a relatively narrow range after a significant move. The breakout from the pennant signals a continuation of the previous trend.
pennant pattern technical analysis
A pennant pattern chart, in the context of technical analysis in finance, refers to a chart pattern that is considered a continuation pattern.
It is formed when there is a brief consolidation or sideways movement in price after a strong and rapid price movement (upward or downward). The pennant pattern is named for its appearance, as it looks like a small symmetrical triangle or a small symmetrical flag.
Types of Pennant Patterns in Forex
There are two types of pennant pattern charts in FX:
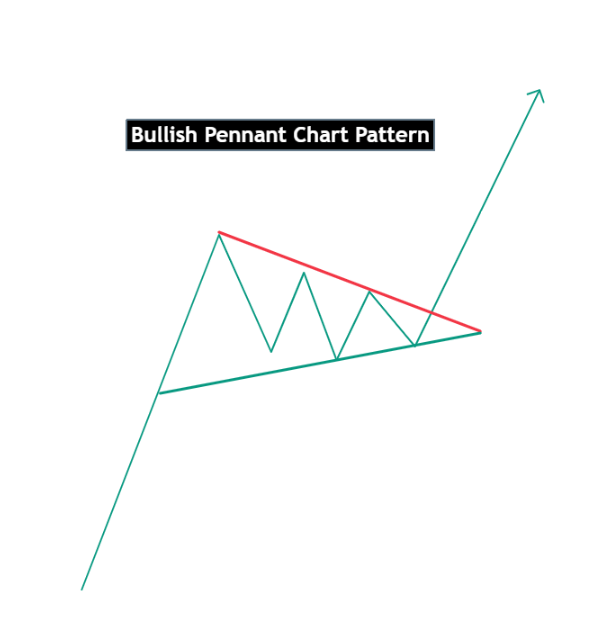
Bullish pennant pattern:
These pennants form after a strong upward move and signal a continuation of the uptrend. The break out from the pennant will be upwards.
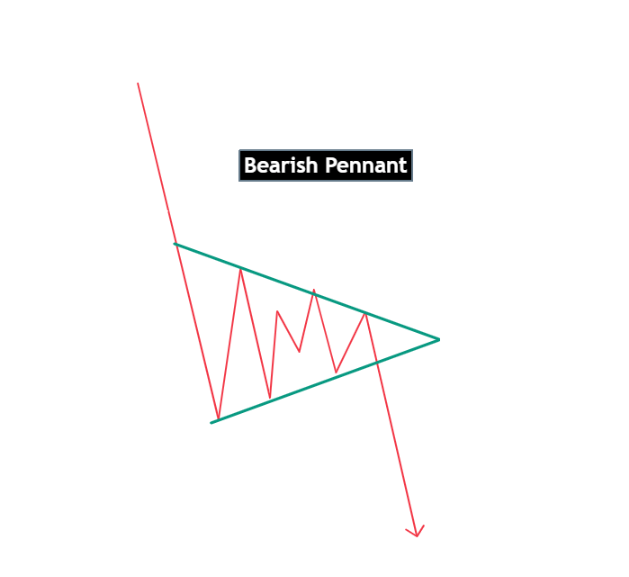
Bearish pennant pattern:
These pennants form after a strong downward move and signal a continuation of the downtrend. The breakout from the pennant will be downwards.
How to Identified Pennant Chart Patterns in Stock
Converging Trendlines:
The converging trendlines are a crucial aspect of identifying a pennant. As the pattern develops, observe the trendlines coming together to form a triangular shape.
The converging trendlines signify a period of consolidation, where the market is taking a breather before a potential continuation of the prior trend.
Flagpole:
The flagpole is a strong and rapid price movement that precedes the pennant. It acts as the initial impulse that sets the stage for the consolidation phase.
The flagpole should be at least twice as long as the pennant. This length comparison emphasizes the significance of the prior trend, indicating a substantial and decisive move in the market.
Volume:
Monitoring volume is crucial when identifying a pennant. During the consolidation phase, which forms the pennant, the volume should typically decrease.
The decrease in volume suggests a contraction of trading activity as market participants show less interest or commitment during this period of price consolidation. This diminishing volume is a key characteristic of the pattern.
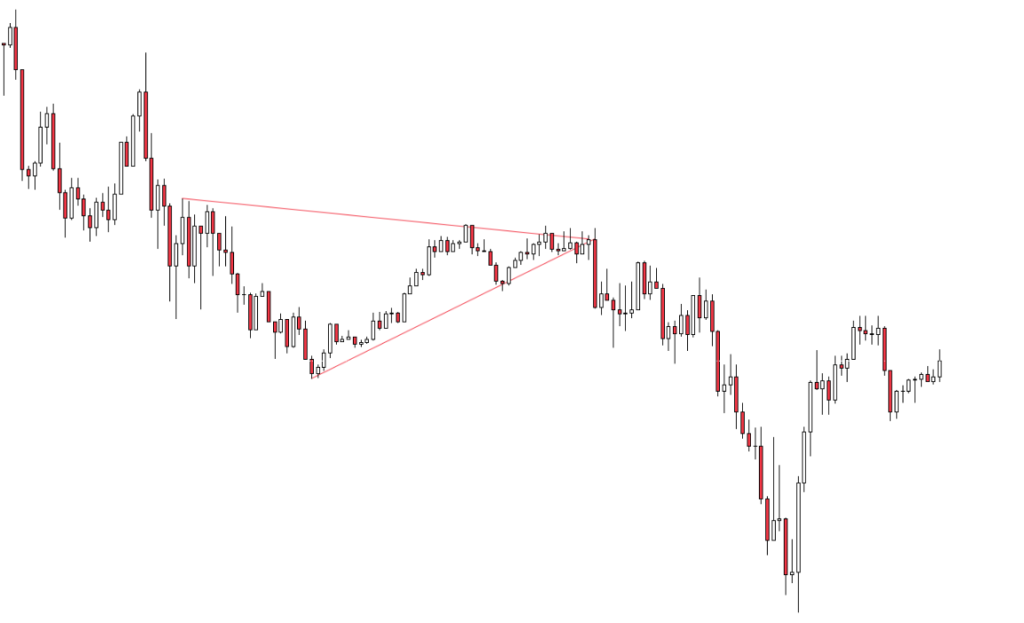
Pennant Chart Pattern Example
- Dark Cloud Cover: A Guide to Trading This Bearish Candlestick Pattern - 26 December 2023
- Title: Piercing the Veil of Market Sentiment: The Piercing Pattern in Trading - 26 December 2023
- Bullish Marubozu: A Comprehensive Guide to Trading with Confidence - 26 December 2023