Pin Bars are important in technical analysis because they offer valuable insights into the psychology of the market. The long wick signifies a strong rejection of the current price level, while the small body suggests indecision and a possible shift in momentum.
Definition of Pin Bar
A Pin Bar is a powerful single candlestick pattern used in technical analysis to identify potential reversals in price. It is characterized by a long wick (or shadow) on one end and a small body close to the opposite end.
Key characteristics of a Pin Bar:
- Long wick: The wick extends significantly beyond the body, indicating strong buying or selling pressure.
- Small body: The body is small compared to the wick, suggesting indecision and a potential rejection of the current price level.
- Color: The color of the body can be either bullish (green) or bearish (red), depending on the position of the wick.
Types of Pin Bars:
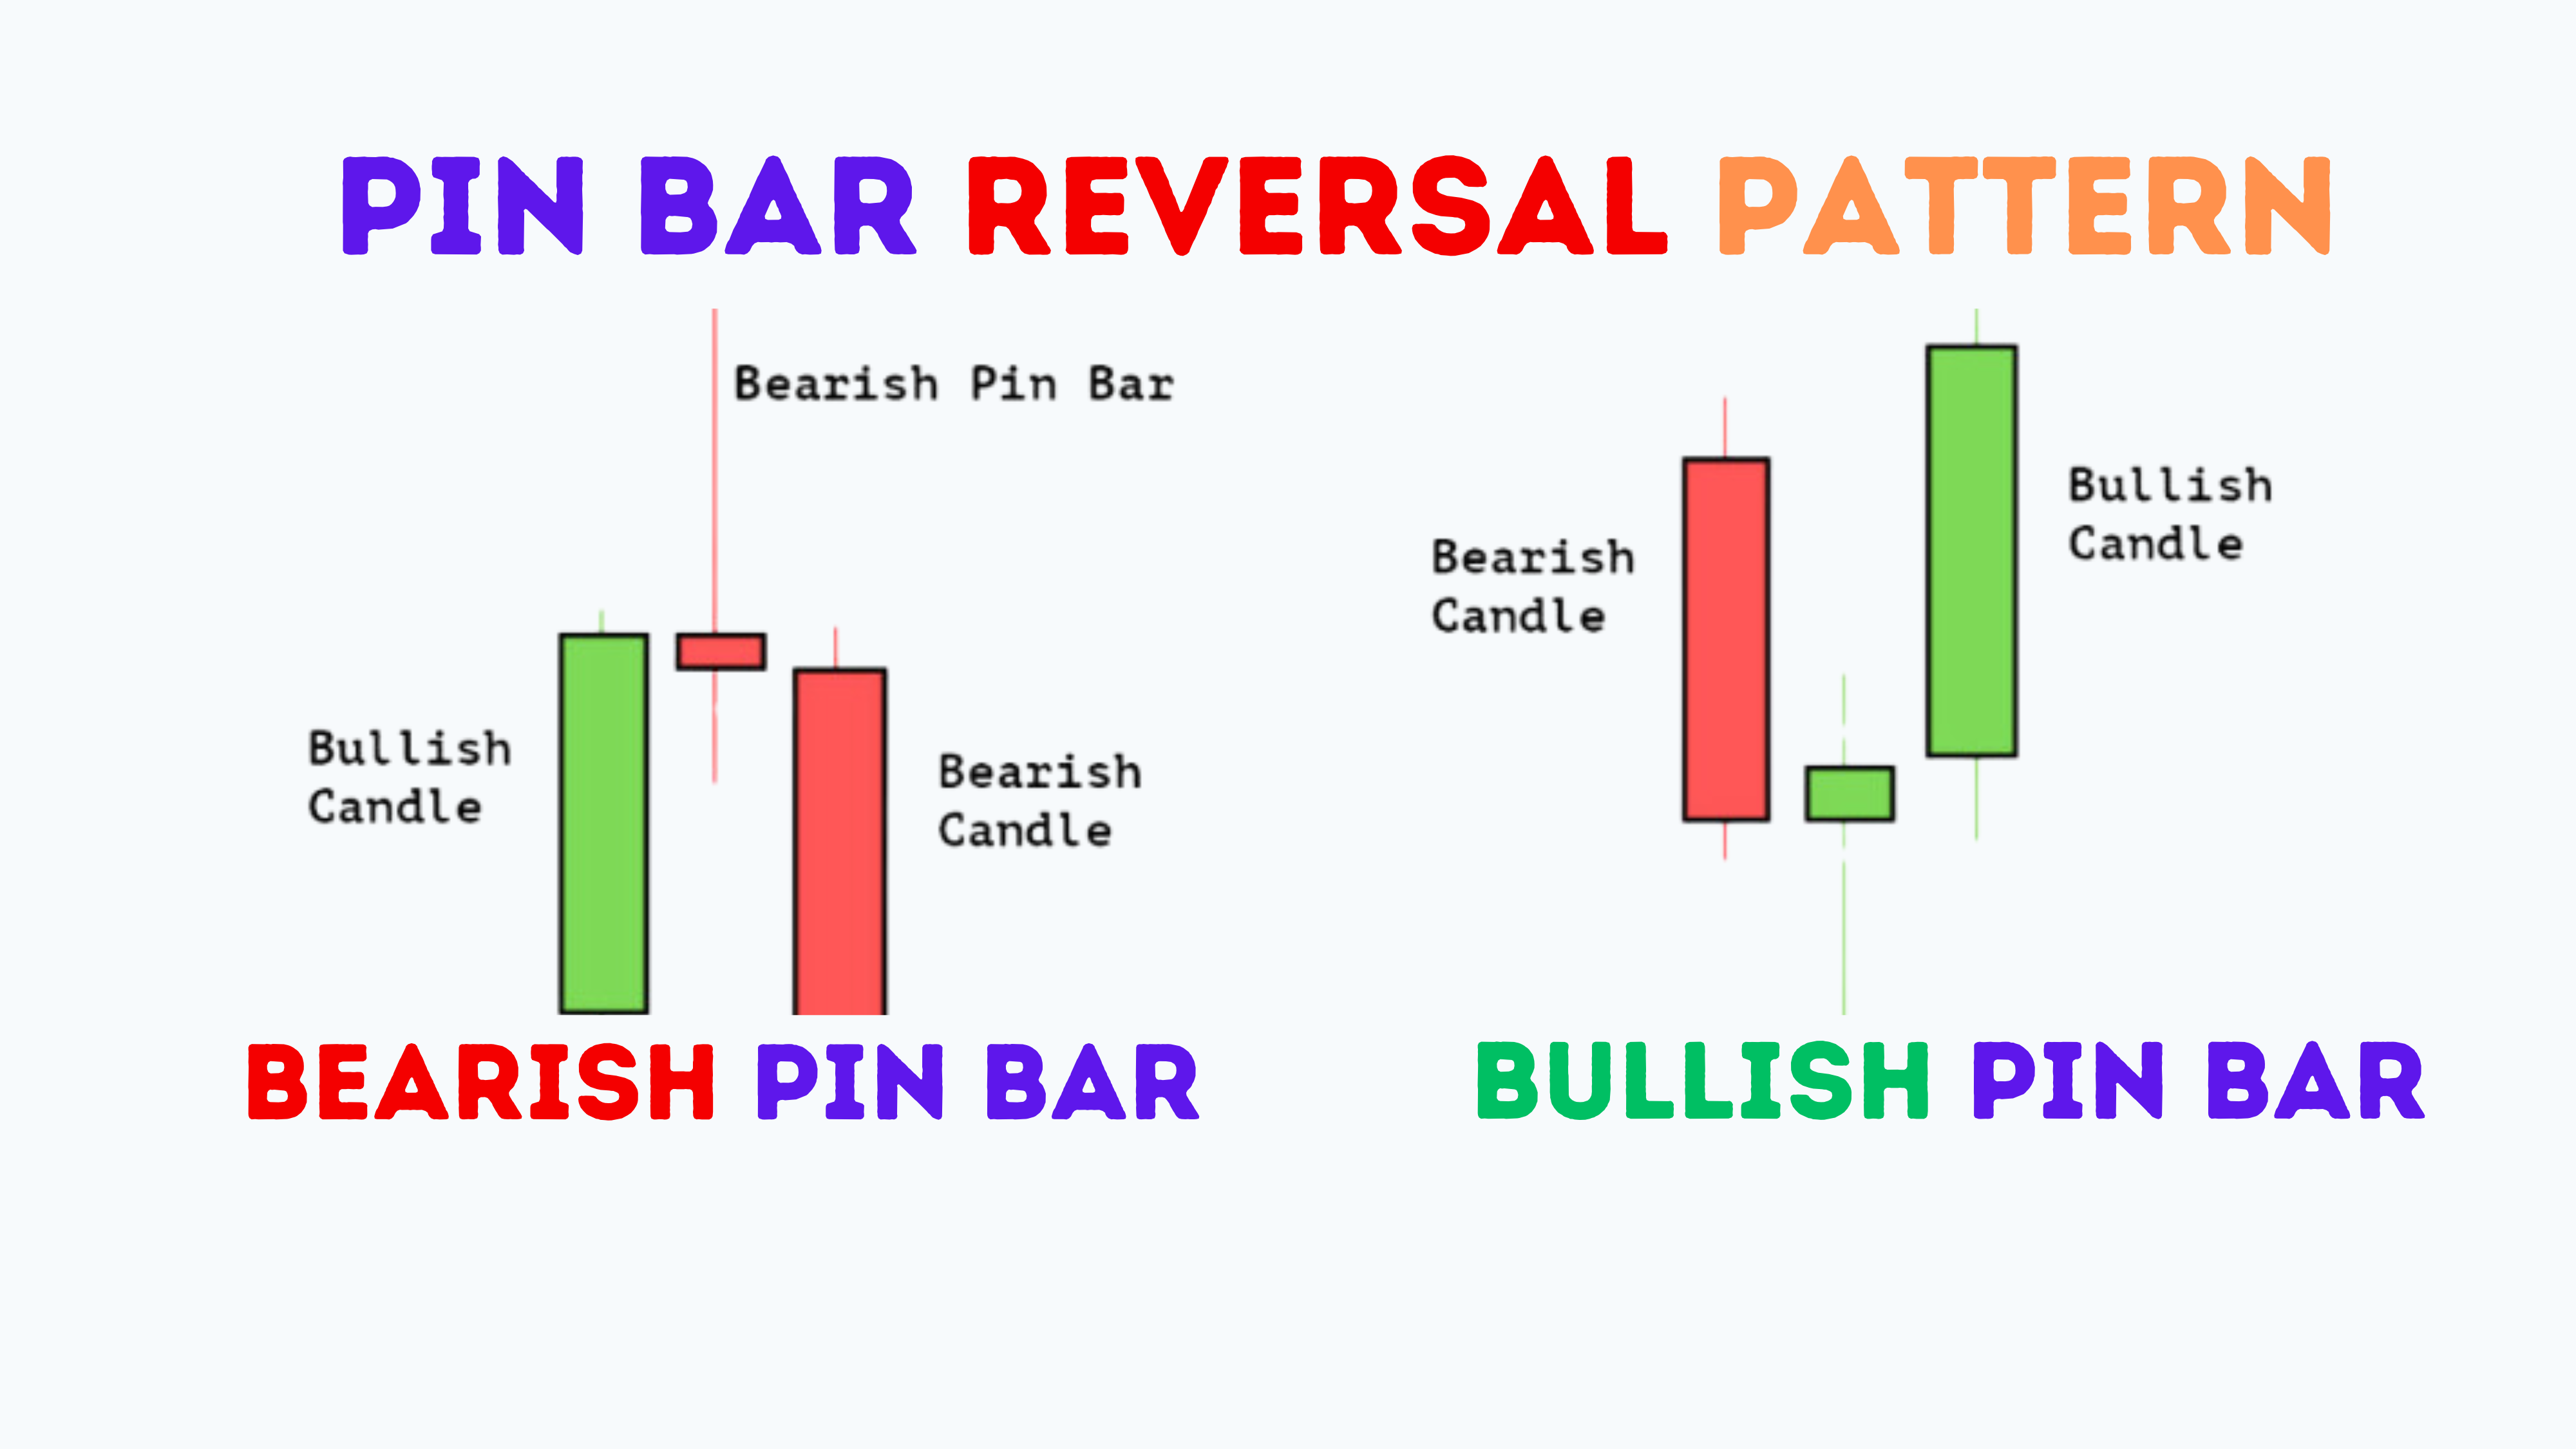
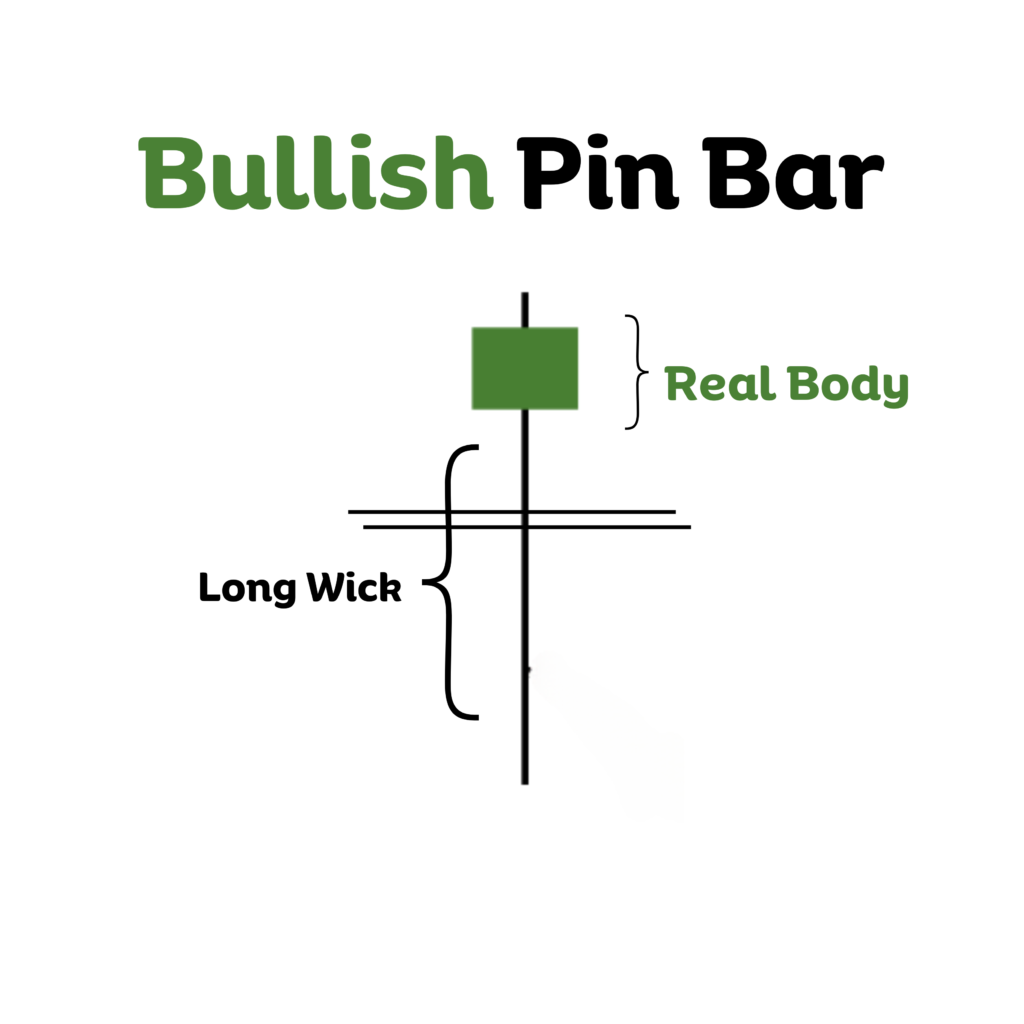
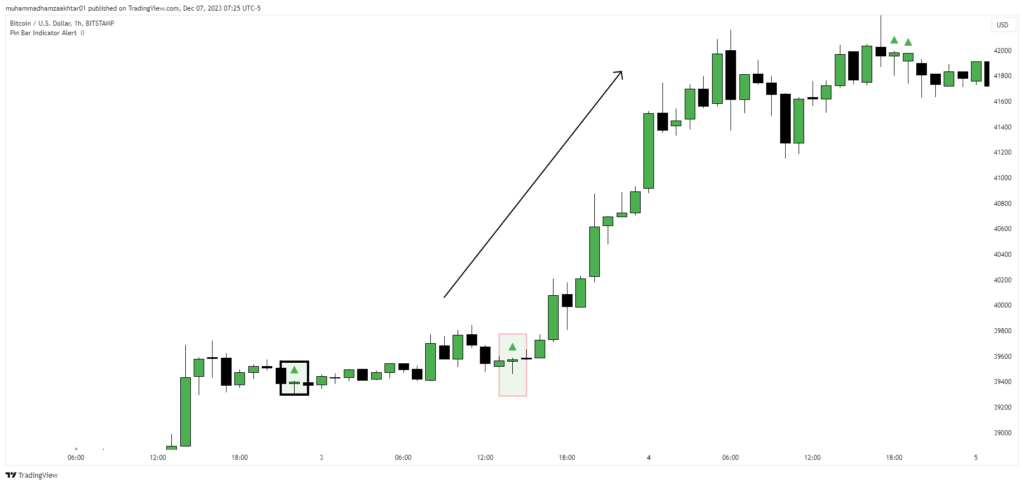
Bullish Pin Bar: A bullish Pin Bar Candle has a long lower wick and a small body near the high. It suggests that a price decline was rejected and a potential upward reversal is imminent.
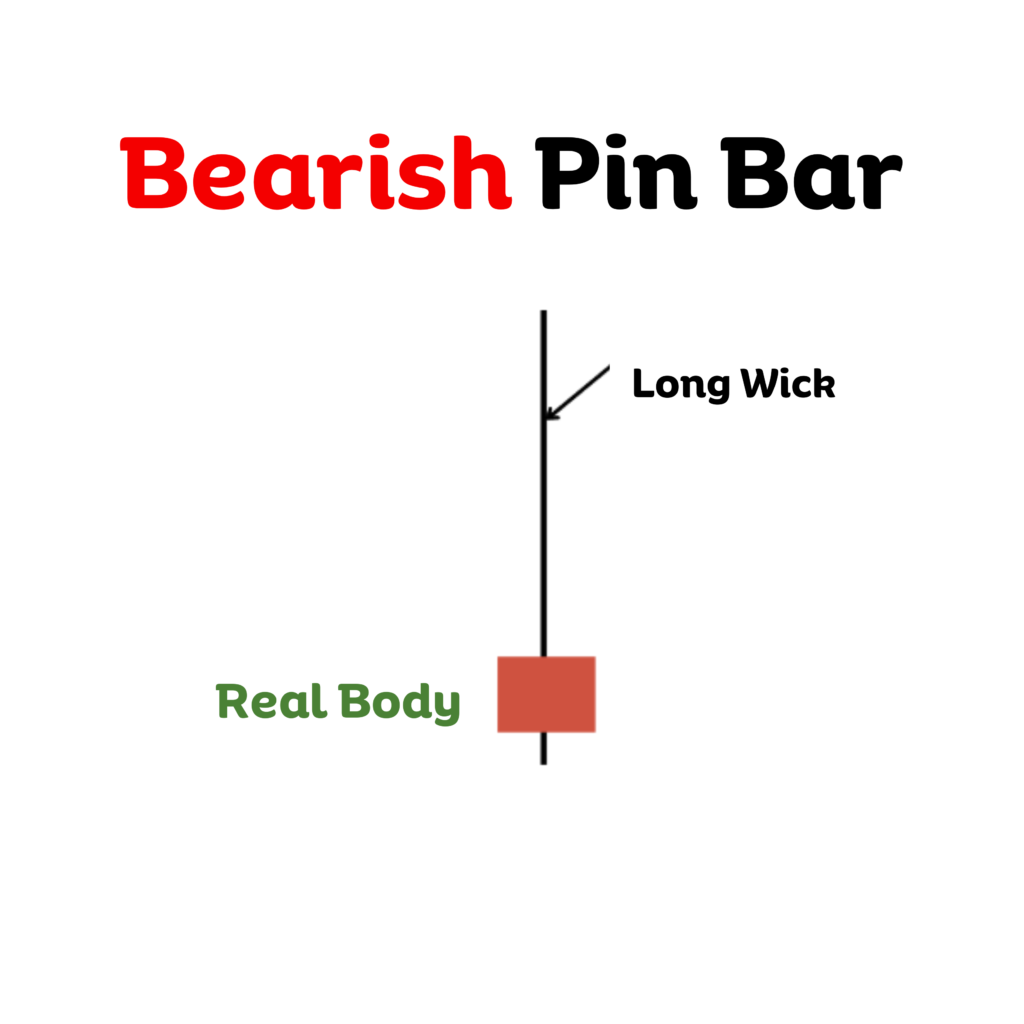
Bearish Pin Bar: A bearish Pin Bar Candle has a long upper wick and a small body near the low. It indicates that a price rally was rejected and a potential downward reversal is underway.
why Pin Bars are important:
- Identify potential reversals: Pin Bars can help traders identify potential turning points in the market and adjust their trading positions accordingly.
- Confirm existing trends: Pin Bars can also be used to confirm existing trends. For example, a bullish Pin Bar appearing during an uptrend can provide additional confirmation that the trend is likely to continue.
- Measure volatility: The length of the wick can be used to gauge market volatility. A long wick suggests that there is a lot of uncertainty and volatility surrounding the current price level.
- Set stop-loss orders: Pin Bars can be used to set stop-loss orders below the low of a bearish Pin Bar or above the high of a bullish Pin Bar. This helps to protect traders from potential losses if the price moves against their expectations.
pin bar candle pattern Structure:
Small Body:
The body of a candlestick represents the range between the open and close price for a specific period. A small body indicates that the difference between the opening and closing price was minimal, suggesting indecision or stalemate between buyers and sellers.
Long Wick/Shadow:
The wick (or shadow) of a candlestick is the line extending above and below the body, representing the highest and lowest price reached during the period. A long wick indicates significant price volatility and a strong rejection of the price level at the end of the wick.
Location on Price Chart
The location of a candlestick on a price chart can provide additional insights into its meaning. Here are two interpretations:
1. Reversal Signal:
A candlestick with a small body and long wick appearing at the end of an uptrend or downtrend can often signal a potential reversal in price direction. The long wick suggests strong selling pressure (at the top of an uptrend) or strong buying pressure (at the bottom of a downtrend), indicating that the current trend may be losing momentum.
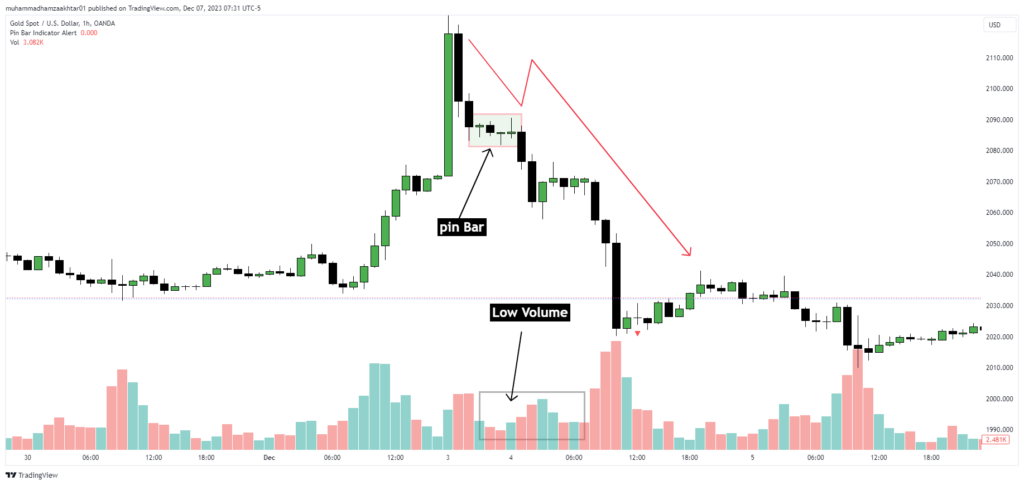
A potential reversal is evident in the December 2023 Gold (XAUUSD) chart. Following a bullish trend, a Pin Bar candlestick formed, signaling a possible shift in momentum and indicating the price of XAUUSD is likely to fall.
A candlestick with a small body and long wick appearing within an existing trend can sometimes signal a continuation of the trend. The long wick can be interpreted as a temporary pullback before the price continues its upward or downward movement.
The above chart of EURUSD show the continuation in momentum. This basically a rally base rally pattern of supply and demand.
Pin Bar Trading Strategy that works
Timeframe Selection: Focus on higher timeframes (daily, weekly) for increased reliability and clearer signals.
Location on the Chart: Look for pin bars at:
- Key support or resistance levels.
- After strong trends, indicating potential reversals.
Trend Confirmation: Use trendlines or moving averages to confirm the prevailing trend. Pin bars in alignment with the trend are more potent.
Volume Analysis: Confirm signals with higher-than-average volume, as it strengthens the reliability of the reversal.
Pin Bar Trade Entry Options
At Market: Enter the trade at the current market price after the confirmation candle closes.
50% Retracement: Consider entering when the price retraces to the middle of the pin bar’s range.
On-Stop Entry: Place a limit order just below (for Bullish) or above (for Bearish) the pin bar’s extreme point.
Trade Management
Stop Loss Placement: Set the stop loss below the low (for Longs) or above the high (for Shorts) of the pin bar.
Take Profit Strategy: Base take-profit levels on the distance between the pin bar’s high/low and the entry point.
Risk Management: Risk a small percentage of your capital per trade to ensure disciplined trading.
Additional Strategies:
- Inside Pin Bars: Look for a Pin Bar within the body of a previous large candlestick, suggesting indecision within the trend.
- Pin Bars in Trends: Treat Pin Bars with long wicks in the trend direction as pullbacks, not reversals.
- Combine with Indicators: Use Pin Bars alongside other technical indicators (e.g., RSI, MACD) for better confirmation.
Bonus Tips:
- Practice in a demo account before risking real capital.
- Stay disciplined and avoid impulsive decisions based on emotions.
- Continuously learn and refine your strategy based on market conditions and experience
- Dark Cloud Cover: A Guide to Trading This Bearish Candlestick Pattern - 26 December 2023
- Title: Piercing the Veil of Market Sentiment: The Piercing Pattern in Trading - 26 December 2023
- Bullish Marubozu: A Comprehensive Guide to Trading with Confidence - 26 December 2023