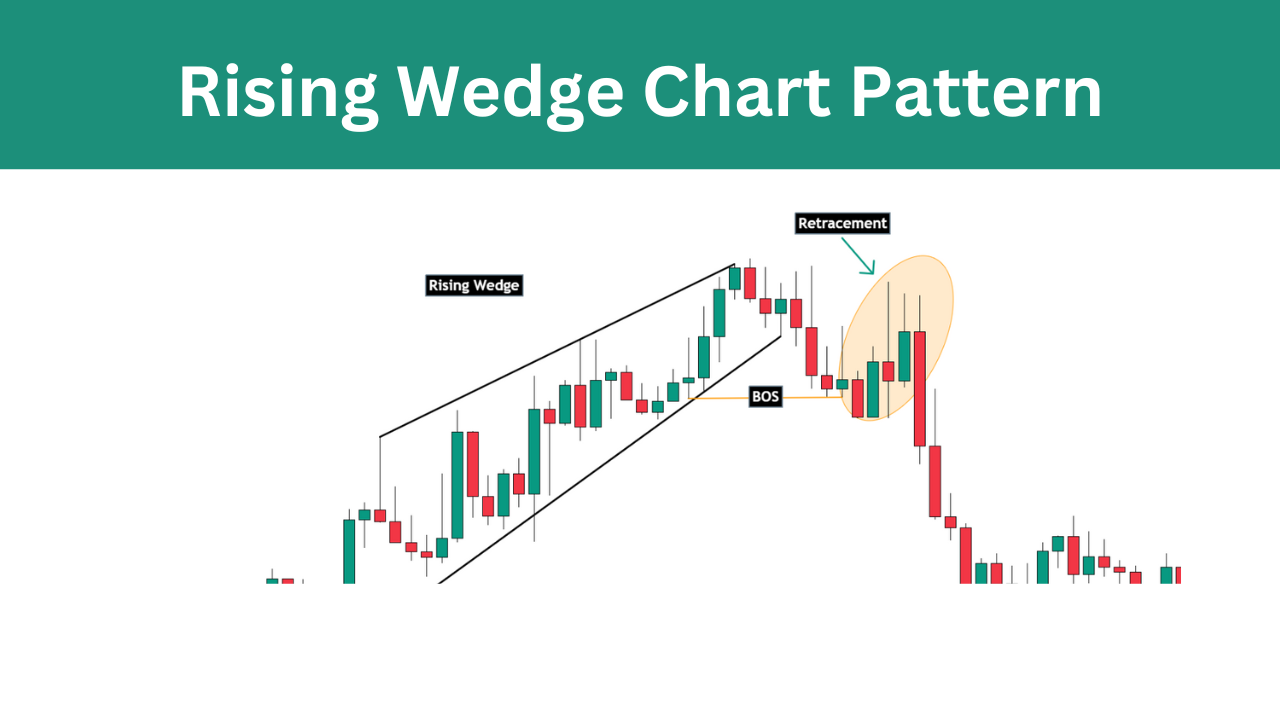
A rising wedge pattern is a technical analysis pattern that is characterized by two converging upward-sloping trendlines and a narrowing price range.
It is considered a bearish continuation pattern, meaning that it is more likely to lead to a downward breakout than an upward breakout.
What is a Rising Wedge Pattern
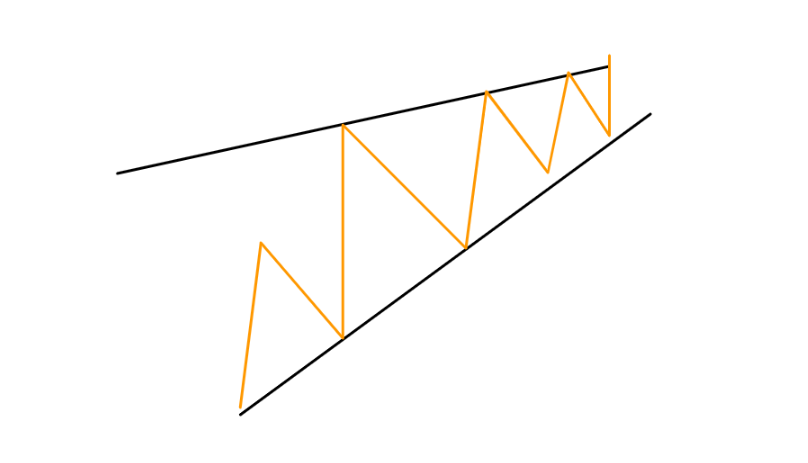
Picture a triangle on a graph, but not just any triangle – one that points upward. Now, this particular triangle is created by drawing two lines on a price chart.
These lines aren’t just random; they’re carefully placed to connect the highest and lowest points of the price movement.
As you trace these lines, something interesting starts happening. The space between them starts to shrink like the triangle is getting smaller and tighter.
It’s as if the prices are feeling a bit squeezed within this triangle. This specific geometric formation is what experts refer to as a “rising wedge pattern.”
It’s like a visual cue in the financial world, signaling that something noteworthy might be on the horizon.
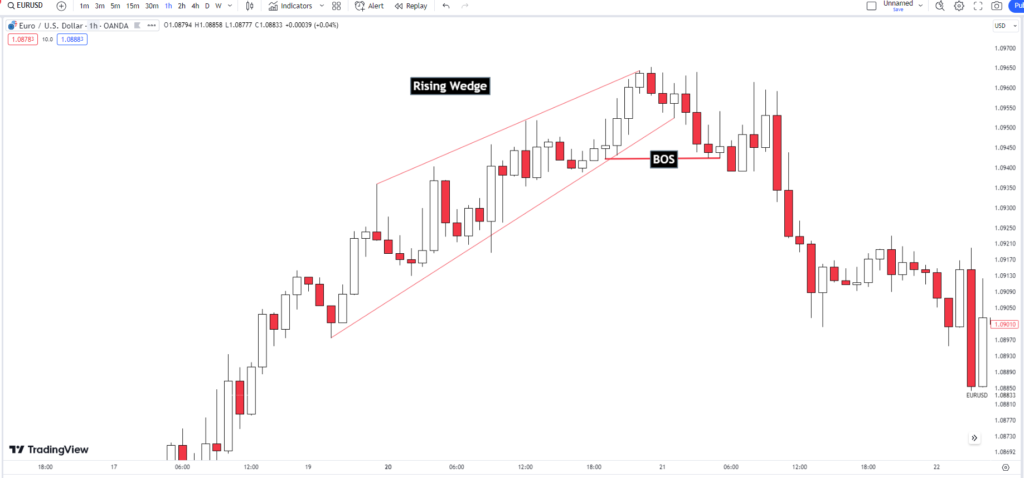
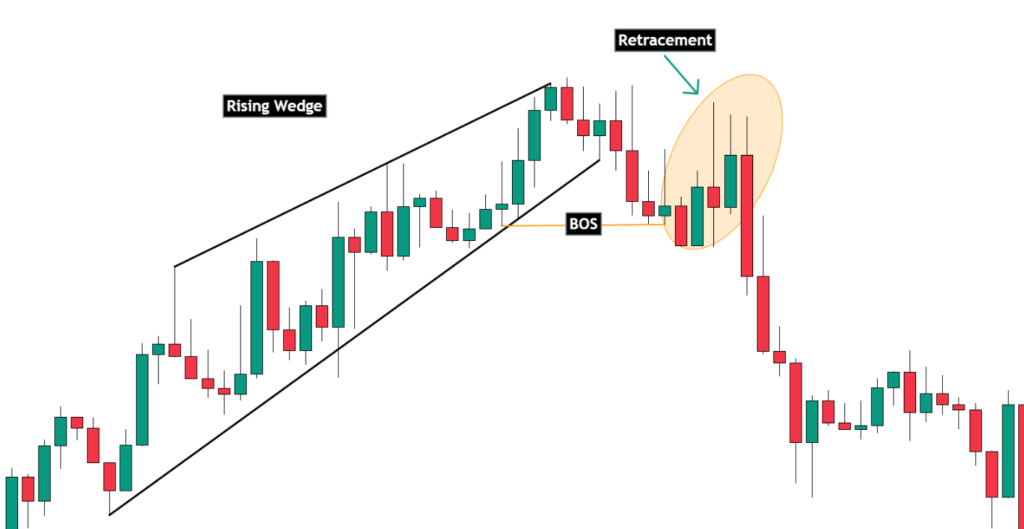
Example of Rising Wedge Chart Pattern EURUSD
The chart displayed below illustrates the development of a rising wedge pattern over a 1-hour time frame for the EURUSD currency pair. Following a confirmed break of the market structure, the price of EURUSD experienced a decline.
How to Identified Rising Wedge Pattern Forex
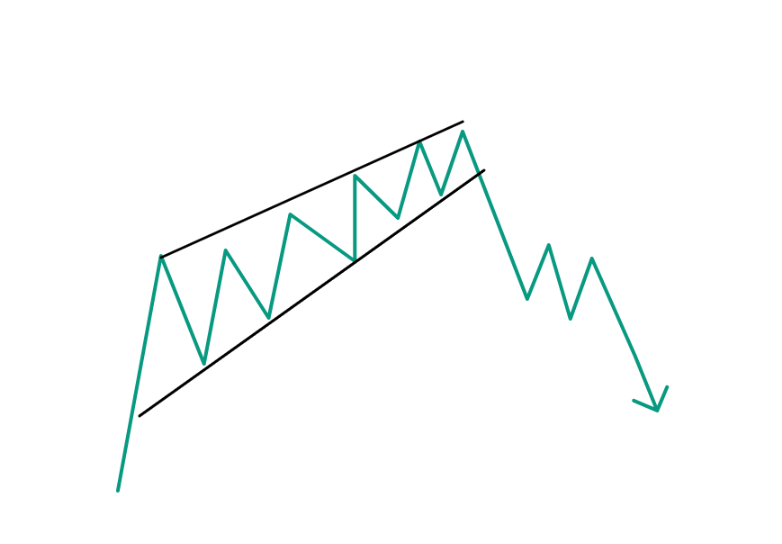
Identifying a Rising Wedge Pattern involves observing the following features:
- Two converging upward-sloping trendlines: Connect these trendlines by linking the swing highs and swing lows of the price action.
- Narrowing price range: Notice the price action progressively tightening as the trendlines converge.
- Formation during an uptrend: Keep in mind that Rising Wedge Patterns usually take shape in the context of an upward trend.
How to Trade a Rising Wedge Pattern
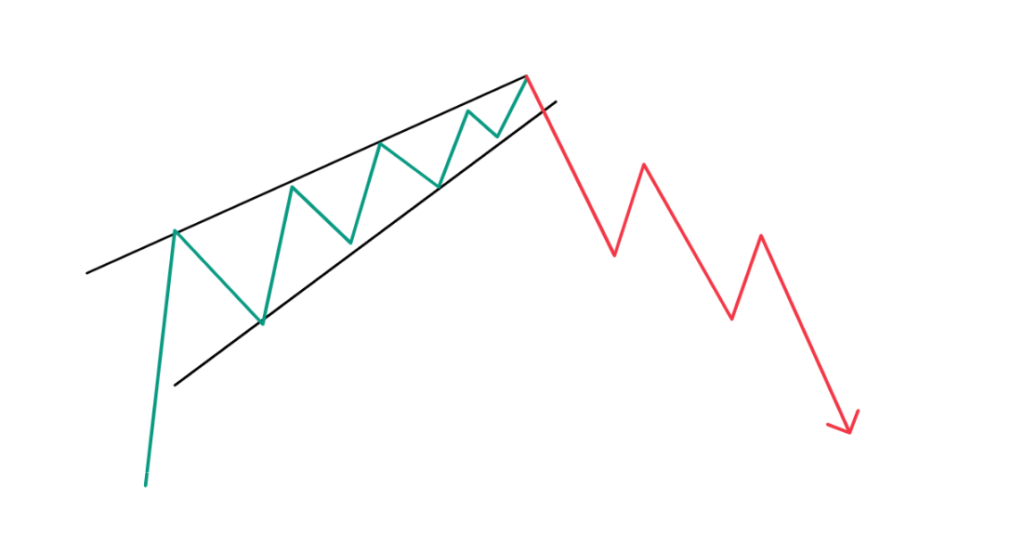
- Spot the Breakout: Keep an eye out for when the price drops below the lower trendline. This signals that the downward trend might be happening.
- Go Short: If the price breaks below that lower line, you can make a move by betting that the price will keep going down. This is what they call entering a “short position.”
- Protect Yourself: Don’t forget to play it safe. Put in an order to stop your losses if the price goes above the upper trendline. This helps limit how much you might lose.
Where to Take Stop Loss
The best place to take a stop-loss order is above the upper trendline of the rising wedge pattern. This will help to limit your losses in case the price breaks above the trendline and continues to rise.
Is the Rising Wedge Pattern Bullish or Bearish
A rising wedge pattern is generally considered a bearish pattern. It often forms during an uptrend and is characterized by two converging trendlines that slope upward, creating a narrowing price range.
The narrowing of the price range within the rising wedge suggests a potential loss of upward momentum.
- Dark Cloud Cover: A Guide to Trading This Bearish Candlestick Pattern - 26 December 2023
- Title: Piercing the Veil of Market Sentiment: The Piercing Pattern in Trading - 26 December 2023
- Bullish Marubozu: A Comprehensive Guide to Trading with Confidence - 26 December 2023