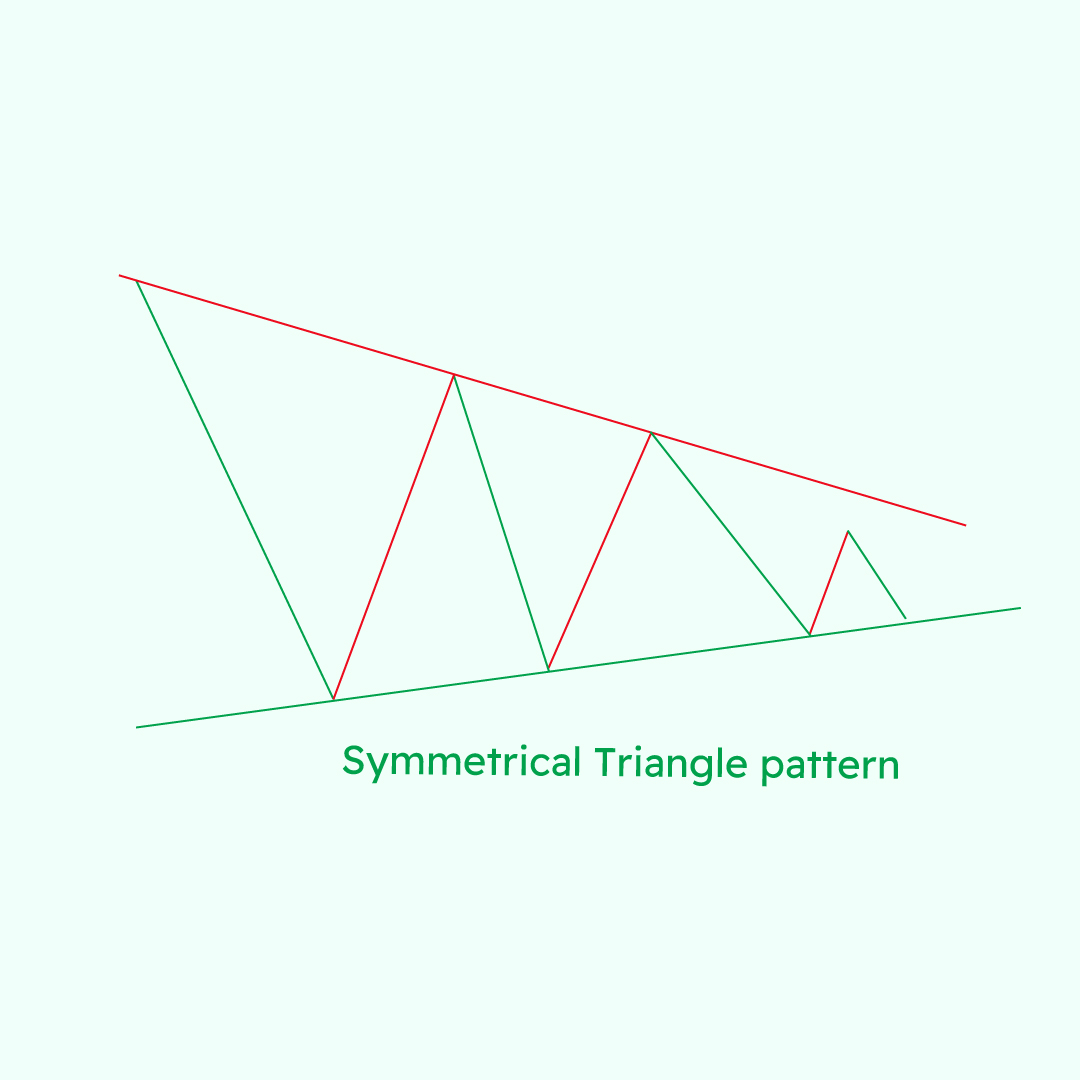
A symmetrical triangle is a chart pattern that can form in both trending and non-trending markets. It is characterized by two converging trend lines connecting a series of lower highs and higher lows.
The upper trend line is drawn by connecting a series of lower highs, while the lower trend line is drawn by connecting a series of higher lows. These trend lines converge as the pattern matures, creating a triangle shape.
How symmetrical triangles form
There are two main ways that symmetrical triangles can form:
- Consolidation during a trend: A symmetrical triangle can form as a consolidation pattern before the price continues in the direction of the trend. This is the most common way that symmetrical triangles form.
- Continuation pattern within a range: A symmetrical triangle can also form as a continuation pattern within a trading range. This type of symmetrical triangle is less common, but it can still be a valuable trading tool.
How to identify a symmetrical triangle
There are a few key things to look for when identifying a symmetrical triangle:
- Two converging trend lines: The upper and lower trend lines should converge as the pattern matures.
- Equal distance between the trend lines: The distance between the upper and lower trend lines should be roughly equal throughout the pattern.
- Volume: Volume should typically decrease as the pattern matures and increase on the breakout.
How to trade a symmetrical triangle
There are a few different ways to trade a symmetrical triangle. Here are a few common approaches:
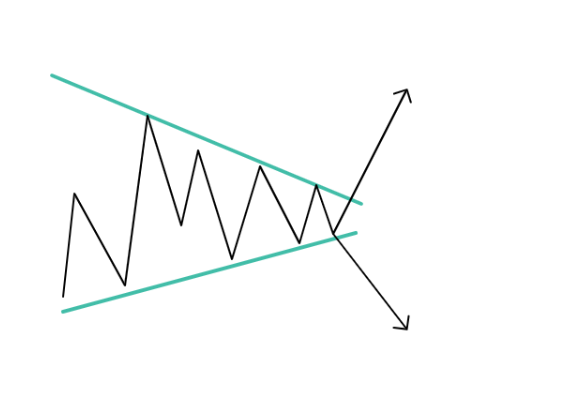
- Breakout trading: This involves placing a buy order above the upper trend line or a sell order below the lower trend line. The stop-loss order should be placed below the lower trend line for a long trade or above the upper trend line for a short trade.
- Trading the range: This involves buying near the lower trend line and selling near the upper trend line. The stop-loss order should be placed outside of the triangle.
- Using technical indicators: Some traders use technical indicators to confirm breakouts from symmetrical triangles. Common indicators include the Relative Strength Index (RSI) and the Stochastic Oscillator.
Tips for trading symmetrical triangles
Here are a few tips for trading symmetrical triangles:
- Wait for confirmation: Do not enter a trade until the price breaks out of the triangle.
- Use stop-loss orders: Always use stop-loss orders to limit your risk.
- Manage your position size: Do not over-commit to any one trade.
- Use other technical indicators: Use other technical indicators to confirm the breakout.
Conclusion
The symmetrical triangle is a neutral chart pattern that can be used to identify potential breakouts. However, it is important to remember that there is no guarantee that the price will break out of the triangle in any particular direction. As with any trading strategy, it is important to use proper risk management and only trade with capital that you can afford to lose.
I hope this blog post has been helpful. If you have any questions, please feel free to leave a comment below.
Additional notes
- Symmetrical triangles are often referred to as “coils” or “flags.”
- Symmetrical triangles can be difficult to trade because they do not provide a clear direction for the price.
- Trade management is essential when trading symmetrical triangles. Stop-loss orders should be used to limit risk.
- Dark Cloud Cover: A Guide to Trading This Bearish Candlestick Pattern - 26 December 2023
- Title: Piercing the Veil of Market Sentiment: The Piercing Pattern in Trading - 26 December 2023
- Bullish Marubozu: A Comprehensive Guide to Trading with Confidence - 26 December 2023