In the world of trading, there are many different technical concepts that can be used to identify potential trading opportunities. One such concept is the ICT Fair Value Gap (FVG).
The ICT FVG helps traders find these imbalances and make trades based on them. Learning how to use it can improve a trader’s chances of success in the market.
In this blog post, we’ll talk about what an ICT FVG is, how to spot it, and how to trade using it.
What is an ICT Fair Value Gap FVG?
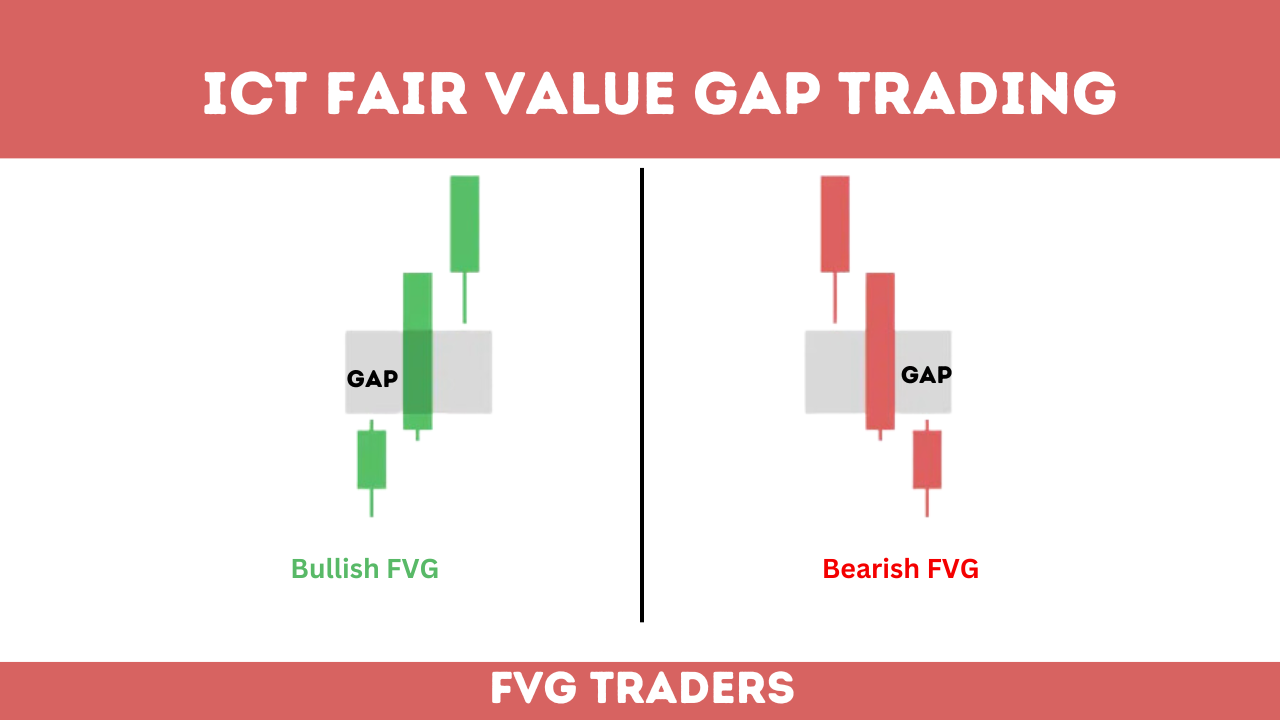
The ICT FVG is a three candle stick pattern that show imbalance on the price and give an opportunity to trader to execute their trades.
A Fair Value Gap (FVG) is a price imbalance on a chart that is created by three candles. The middle candle is a large candle that is significantly wider than the other two candles. The first and third candles are smaller candles that do not fully overlap the large candle.
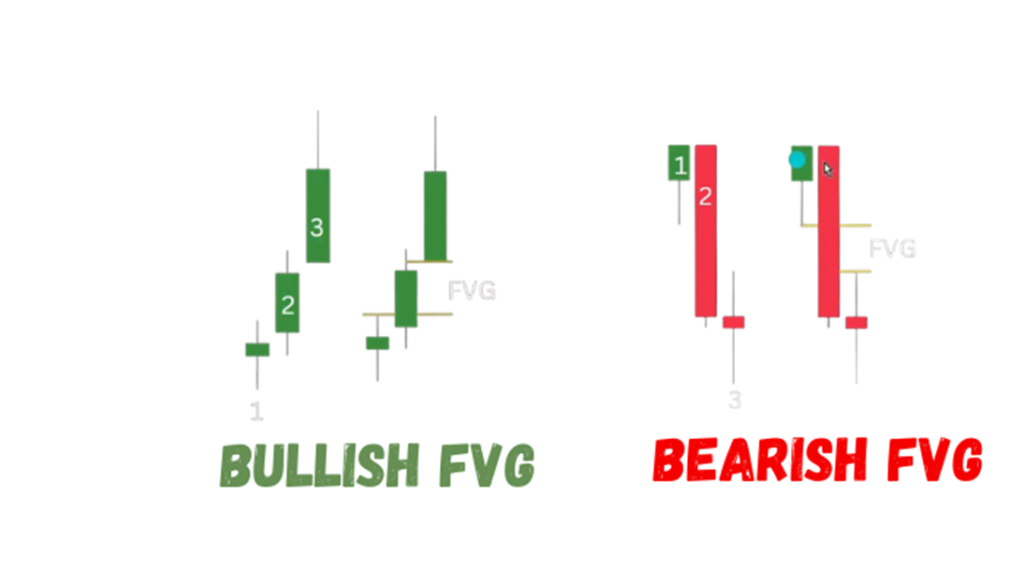
FVGs can be either bullish or bearish, depending on the direction of the price move. A bullish FVG is formed when the price gaps up, indicating that there is more buying pressure than selling pressure. A bearish FVG is formed when the price gaps down, indicating that there is more selling pressure than buying pressure
ICT Bullish Fair Value Gaps(BISI)
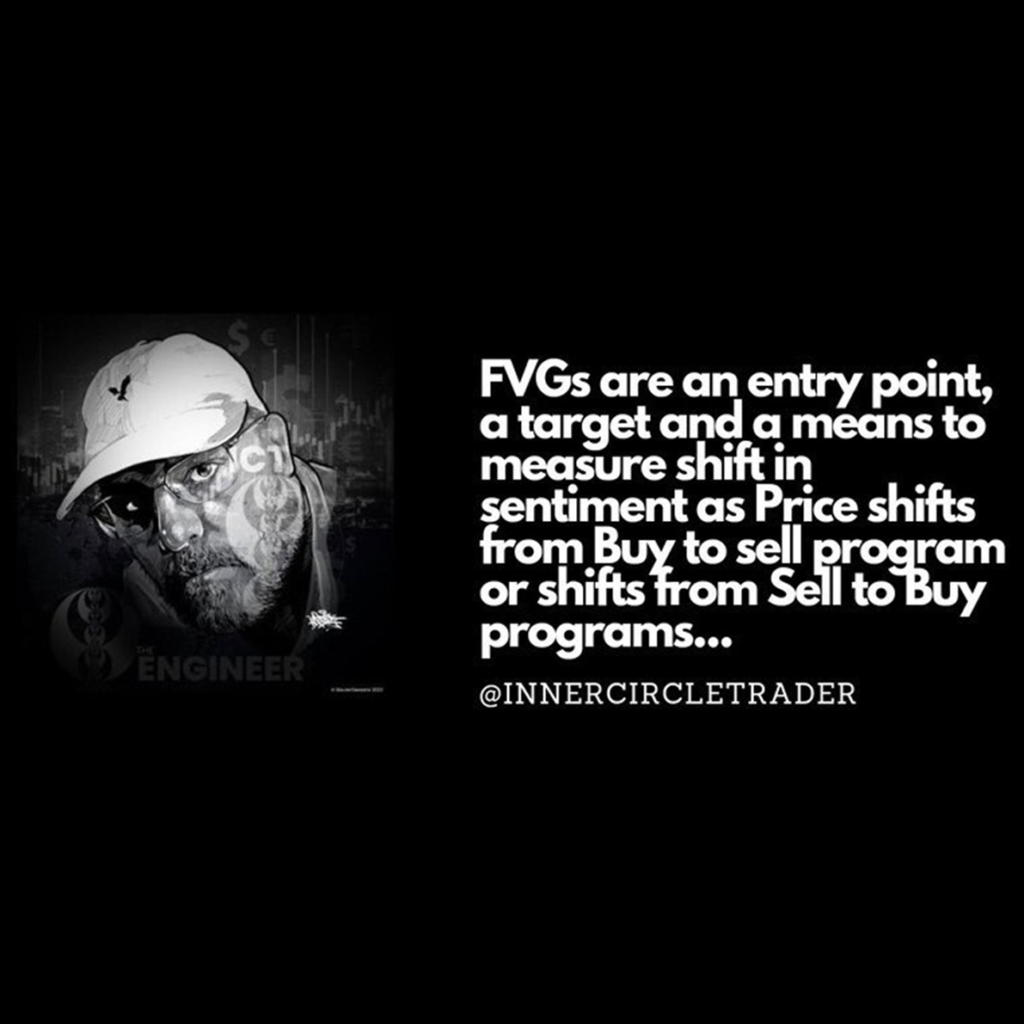
Inner Circle Trader (ICT) defines a bullish Fair Value Gap (FVG) as a Buy Side Imbalance Sell Side Inefficiency (BISI).
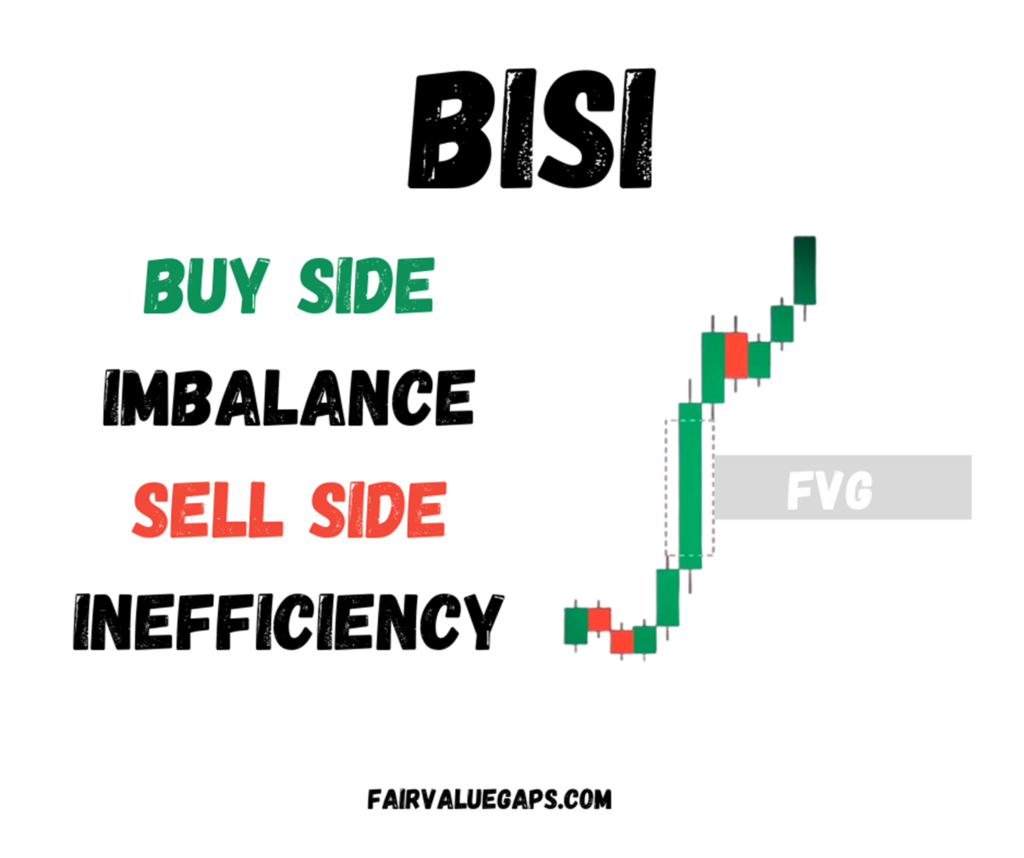
This means that the price is only being pushed up by buyers, and there is no selling pressure to offset it. This creates an imbalance in the market, and the price is likely to retrace back to fill this imbalance.
ICT traders look for bullish FVGs to enter long trades. They do this by waiting for the price to fill this imbalance created by FVG. Place stops loss below the body of 2nd candle or below the body of 1st candle in long trade
ICT Bearish FVG (SIBI)
ICT defines a bearish FVG as a Sell Side Imbalance Buy Side Inefficiency (SIBI). This means that the price is only being pushed down by selling pressure and there is no buying pressure to offset it.
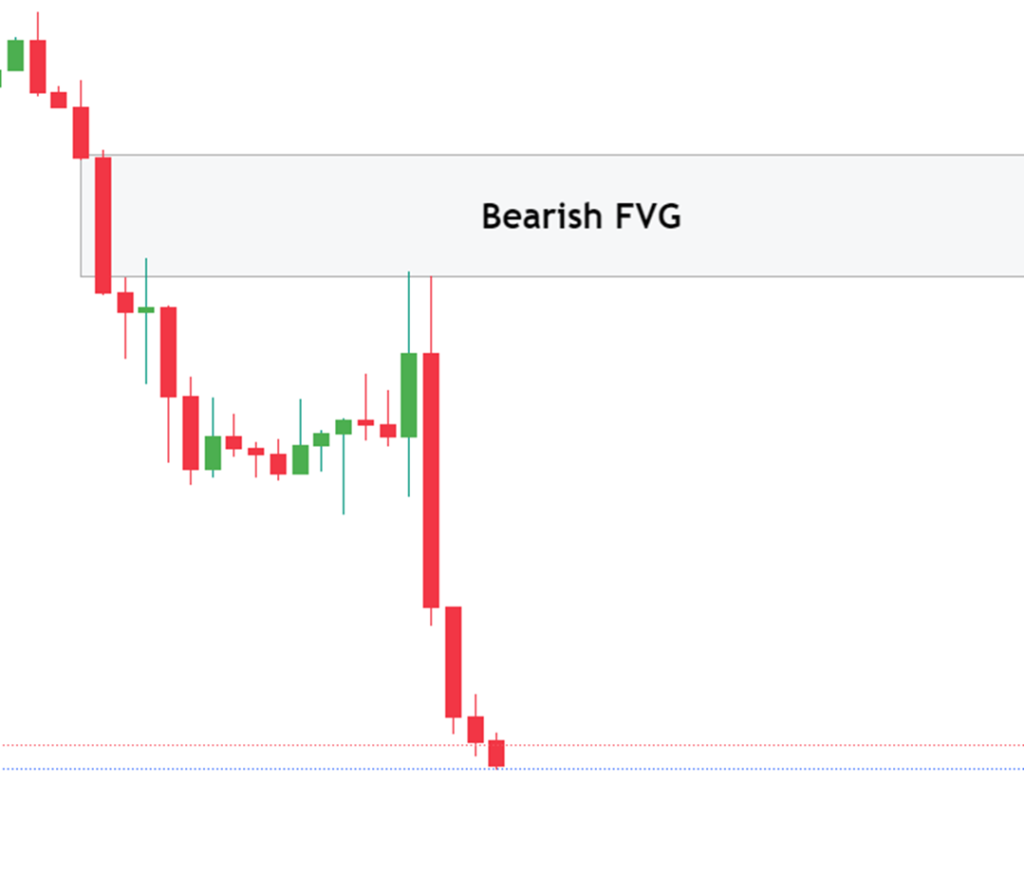
This creates an imbalance in the market, and the price is likely to retrace back to fill this imbalance.
When the price approaches the Fair Value Gap (FVG), traders can consider executing short trades. For added safety, they can place their stop loss orders either:
Both strategies provide different levels of risk management, and traders may choose the one that aligns best with their risk tolerance and trading style.
How to Trade Fair Value Gap
Every imbalance is rebalanced in the future, but it does not always provide an opportunity for a trade.
Imbalances in the market will eventually be corrected, it is not always clear when or how this will happen. As a result, traders need to look for additional confluence before entering a trade.
Liquidity Hunts
Liquidity on charts are present in the form of buy stops or sell stops. The ultimate driven on the market is to hunt these spot. If market recently hunt buy stops its next target is sell spot.
If market hunt sell stop its ultimate goal is to hunt buy stop. See the chart and check from where price is coming and where it is going.
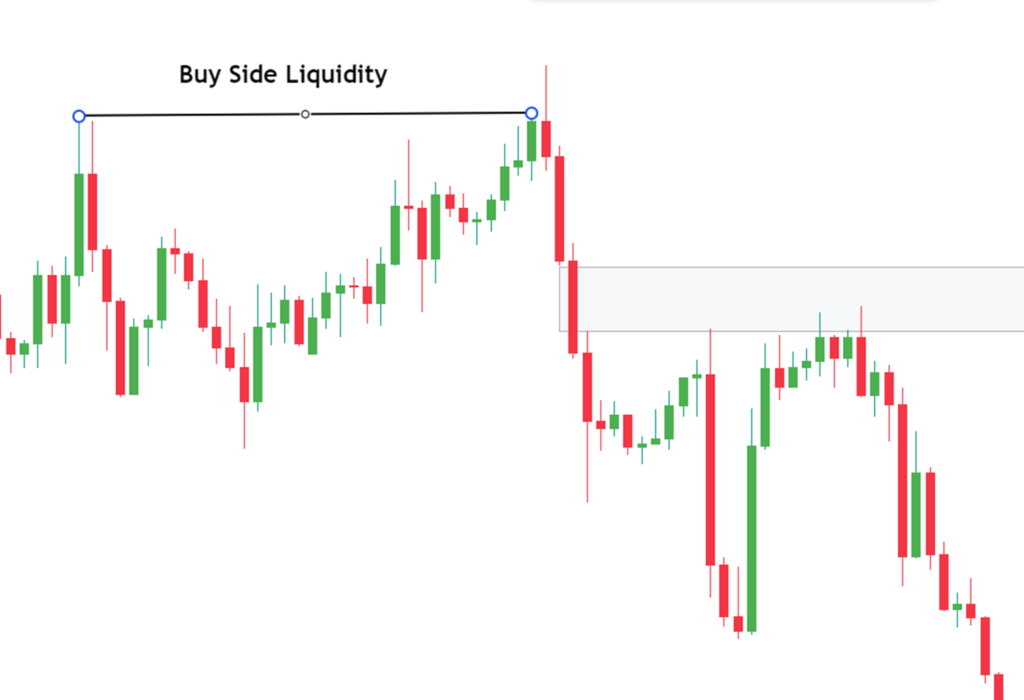
This help you in building a narrative to take long or short position. Once you build your bias the next thing is to find is MSS
Market Structure Shift (MSS)
Market structure shift is refer to change in the direction of market. Or simply you say sometimes it’s a change in character or shift in trend of market.
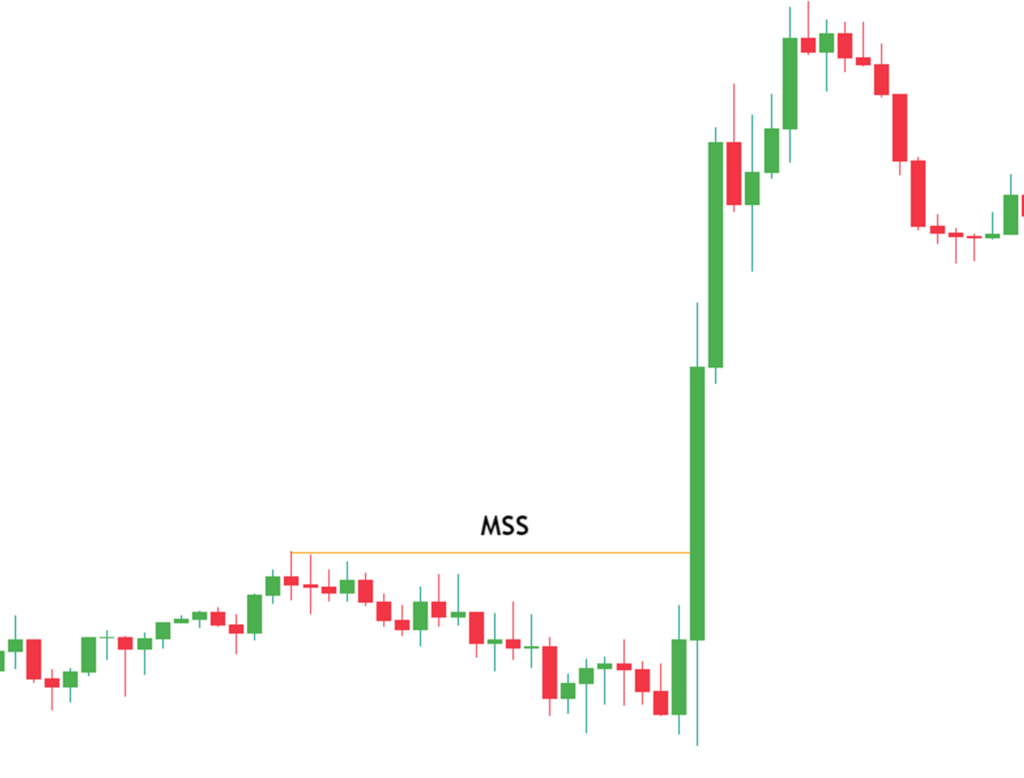
This MSS give an idea that smart money enters and willing the price into particular direction. Most of the time the shift in structure leads an Fair Value Gap.
This MSS give an idea that smart money enters and willing the price into particular direction. Most of the time the shift in structure leads an Fair Value Gap.
Inner Circle Trader FVG Trading Strategy
Entry Strategy
You can enter into the trade when market approaches the fair value gaps and fill the 50% of fvg.
Stop loss is placed on the below of 2nd and 1st candle when taking long trade.
Stop loss is place above the 2nd and 1st candle when take short trades.
Exit Strategy
Target: Take profit is mostly next liquidity pool .Or you can manage according to your
Fair value gap indicator trading view
You can find these imbalances on chart by applying indicator on the trading platform you used it.
- Go to the Trading View website or app and create an account.
- Once you have created an account, search for the “ICT Fair Value Gap” indicator.
- Click on the “Add to Chart” button to add the indicator to your chart.
- The indicator will appear on the chart as a series of colored boxes. The color of the box indicates the direction of the gap. Green boxes indicate bullish gaps, while red boxes indicate bearish gaps.
- You can customize the settings of the indicator by clicking on the gear icon.
- Dark Cloud Cover: A Guide to Trading This Bearish Candlestick Pattern - 26 December 2023
- Title: Piercing the Veil of Market Sentiment: The Piercing Pattern in Trading - 26 December 2023
- Bullish Marubozu: A Comprehensive Guide to Trading with Confidence - 26 December 2023