Trading Supply and demand zones require a deep understanding of market dynamics and the ability to find valid supply and demand zones. In this blogpost we deep dive into the concept of supply and demand and how to utilize them in Forex trading
Supply and demand are fundamental concepts in microeconomics, the study of how individuals and firms make decisions in a market economy. They interact to determine the market price, or equilibrium price, of a good or service, as well as the quantity that will be bought and sold.
What is Supply Zone?
Supply refers to the total amount of a good or service that producers are willing and able to offer for sale at a given price.
When the price of a good or service rises, producers are incentivized to produce more because they can earn more profit. Conversely, when the price falls, producers may reduce production because they may not be able to cover their costs. The relationship between price and supply is positive: as the price of a good or service increases, the quantity supplied also increases.
What are Demand Zones?
Demand refers to the total amount of a good or service that consumers are willing and able to buy at a given price. When the price of a good or service rises, consumers are less willing to buy it because they have less money to spend.
Conversely, when the price falls, consumers are more willing to buy it because they can afford to buy more of it. The relationship between price and demand is negative: as the price of a good or service increases, the quantity demanded decreases.
Equilibrium
The equilibrium price is the price at which the quantity supplied equals the quantity demanded. At this price, there is no surplus or shortage of the good or service. The market is said to be in equilibrium.
Shifts in Supply and Demand
The supply and demand curves can shift due to a number of factors, such as changes in technology, government policies, consumer preferences, and the prices of related goods and services.
When the supply curve shifts, it will cause the equilibrium price and quantity to change. For example, if a new technology makes it more efficient to produce a good, the supply curve will shift to the right, and the equilibrium price will fall.
Supply and Demand Zone in FX Trading
The financial or Forex market operates under the same fundamental principle of supply and demand. When the supply of an asset or instrument exceeds demand, the price will decline. Conversely, when demand outpaces supply, the price will rise until equilibrium is restored.
Traders in the Forex market utilize the law of supply and demand to capitalize on market imbalances.
The constant interplay between buyers (bulls) and sellers (bears) generates the market’s uptrends and downtrends. Bulls seek opportunities to enter trades when prices fall, while bears seek opportunities to enter trades when prices rise.
For instance, if economic data indicates that the economy is performing better than expected, investors may increase their demand for stocks in anticipation of higher earnings.
Conversely, during periods of recession or uncertainty, investors may reduce their exposure to the equity market and seek refuge in safe-haven currencies, assets, or commodities to safeguard their investments.
Another example is the Federal Reserve’s decision to raise or lower interest rates, which often draws attention from traders across all financial markets, particularly the Forex market.
A decision to raise interest rates, for example, enhances the attractiveness of the US dollar to investors, leading to increased demand for the US dollar in the currency market.
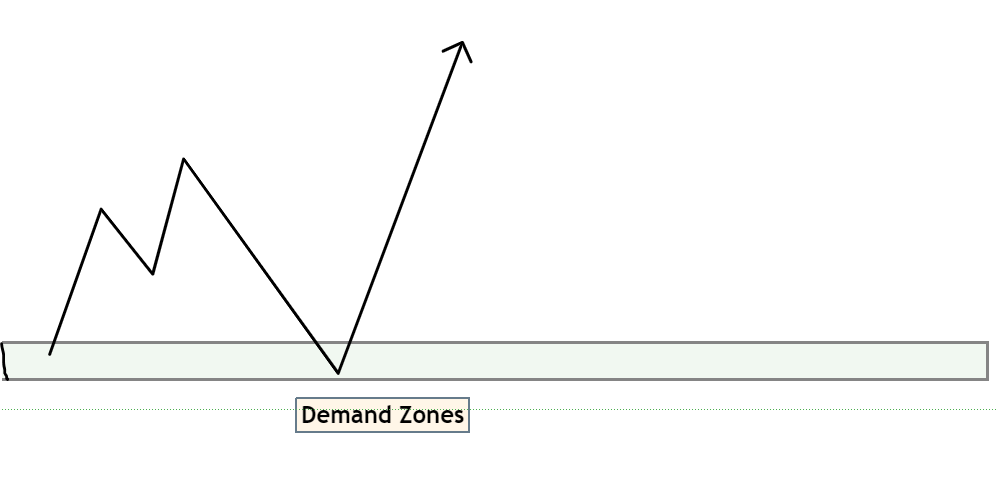
Demand Zones in Trading
In the context of trading, a demand zone refers to a specific price range where buyers are actively purchasing a financial instrument. This concentration of buying activity often leads to a temporary reversal in price direction, as sellers are overwhelmed by the incoming demand.
Several factors contribute to the formation of demand zones. These include:
- Previous support levels: Areas that have previously acted as support, where prices have bounced back from declines, are often viewed as potential demand zones.
- Market sentiment: If market sentiment is generally bullish, traders may be more inclined to enter buy orders at potential demand zones.
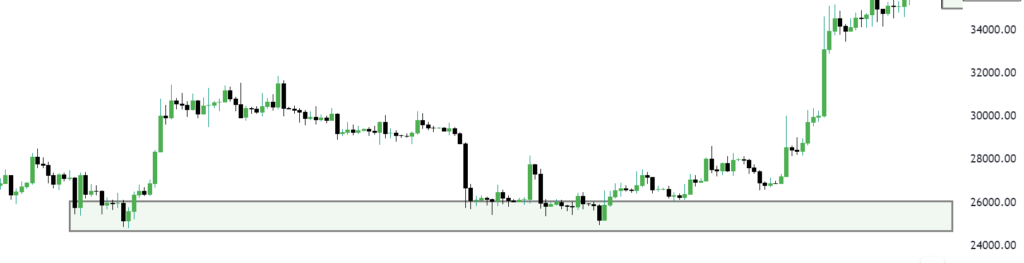
When the price approaches a demand zone, it often experiences a sharp rebound, as buyers step in to purchase the instrument. This creates a series of higher highs and higher lows on the price chart, indicating an upward trend.
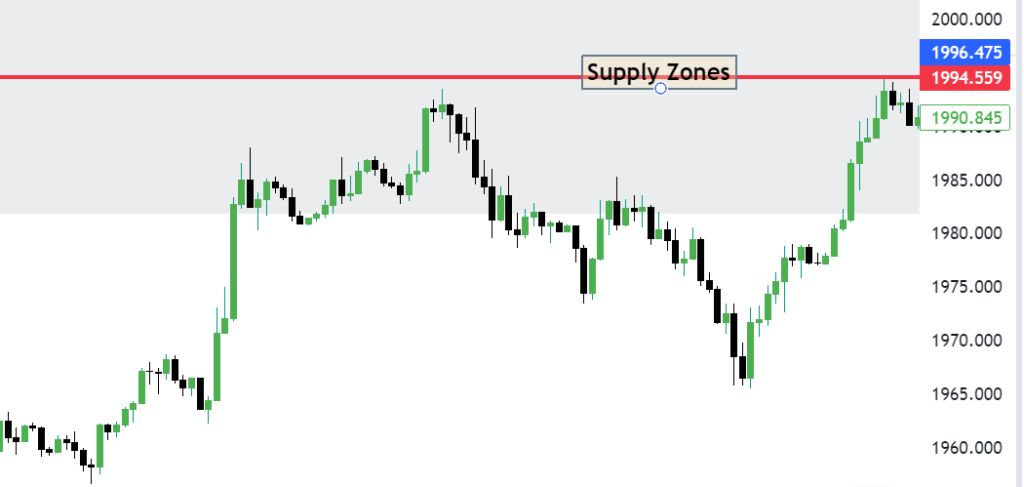
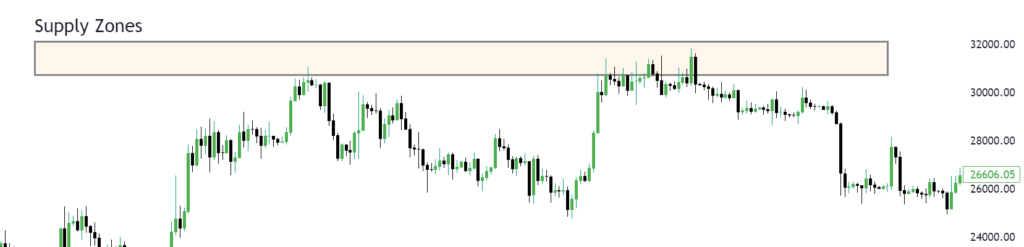
Supply Zones in FX Trading
In contrast, a supply zone represents a price range where sellers are actively selling a financial instrument. This concentration of selling activity often leads to a temporary reversal in price direction, as buyers are unable to absorb the incoming supply.
Similar to demand zones, supply zones are formed due to a combination of factors, including:
Previous resistance levels: Areas that have previously acted as resistance, where prices have struggled to break through, are often viewed as potential supply zones.
Technical indicators: Technical indicators such as moving averages, Fibonacci retracement levels, and Bollinger Bands can signal potential supply zones.
Market sentiment: If market sentiment is generally bearish, traders may be more inclined to enter sell orders at potential supply zones.
When the price approaches a supply zone, it often experiences a sharp decline, as sellers step in to offload the instrument. This creates a series of lower highs and lower lows on the price chart, indicating a downward trend.
Patterns in Supply and Demand Zone
Reversal Patterns
Reversal patterns signal a change in the current market trend, from uptrending to downtrending or vice versa. These patterns typically form when the balance between supply and demand shifts significantly.
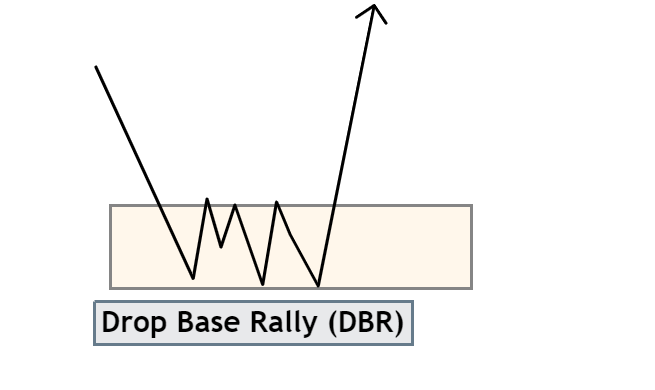
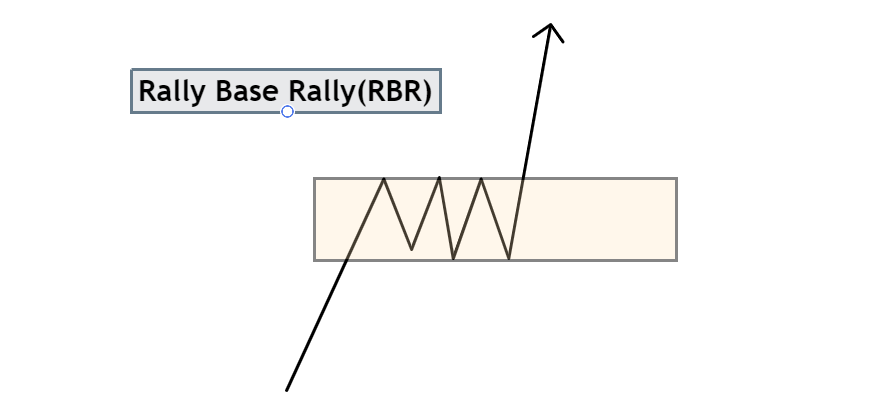
Drop-Base-Rally (DBR): In this pattern, the price initially falls, establishing a temporary base, before experiencing a significant upward rally.
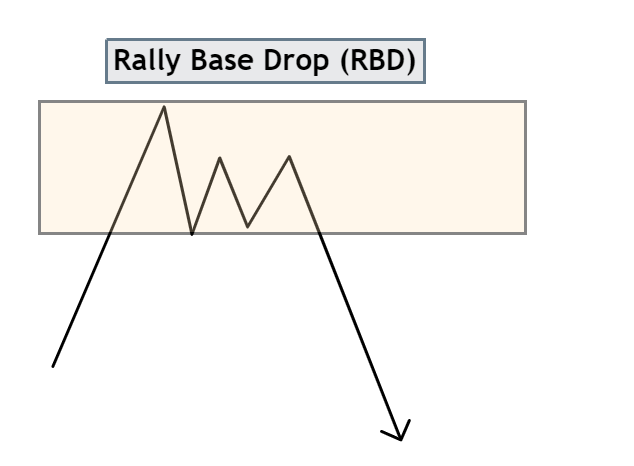
Rally-Base-Drop (RBD): Conversely, the RBD pattern begins with an uptrend, followed by a period of consolidation at the peak of the uptrend. This base marks the starting point for a subsequent downward price movement.
Continuation Patterns
Continuation patterns, as the name suggests, indicate a continuation of the existing market trend. These patterns occur when the price pauses briefly within the overall trend before resuming its direction.
Drop-Base-Drop (DBD): In this continuation pattern, the price experiences a downward movement, forms a temporary base, and then continues to decline further.
Rally-Base-Rally (RBR): Similarly, the RBR pattern involves an upward price movement, followed by a brief pause at a higher level, before resuming its upward trajectory.
How to identify Supply and Demand zones
Supply and demand zones are closely associated with market imbalances, which are characterized by significant price movements, either upwards or downwards. These imbalances arise when either buyers or sellers exert control over the market, driving the price away from its base with strong momentum.
Demand exceeding supply: When demand outpaces supply, the price ascends with large bullish candlesticks.
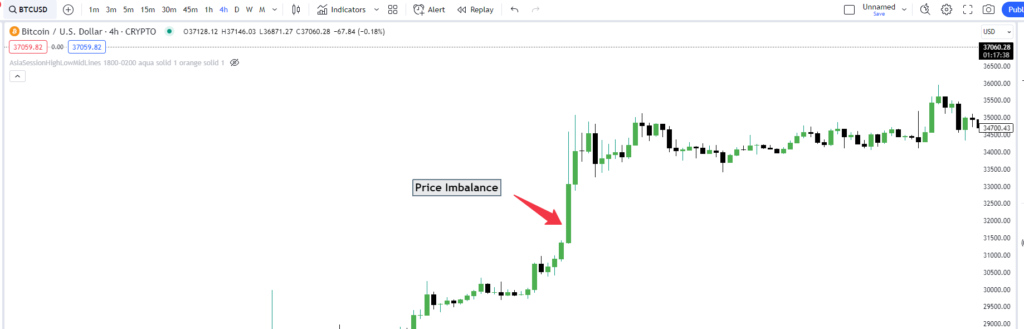
Supply exceeding demand: Conversely, when supply exceeds demand, the price descends with large bearish candlesticks.
These price movements indicate the market’s imbalances. Any imbalance presents a trading opportunity to capitalize on the market’s movement. In any case, the most effective approach to maximize profits from the market move is to align with the trend from its inception.
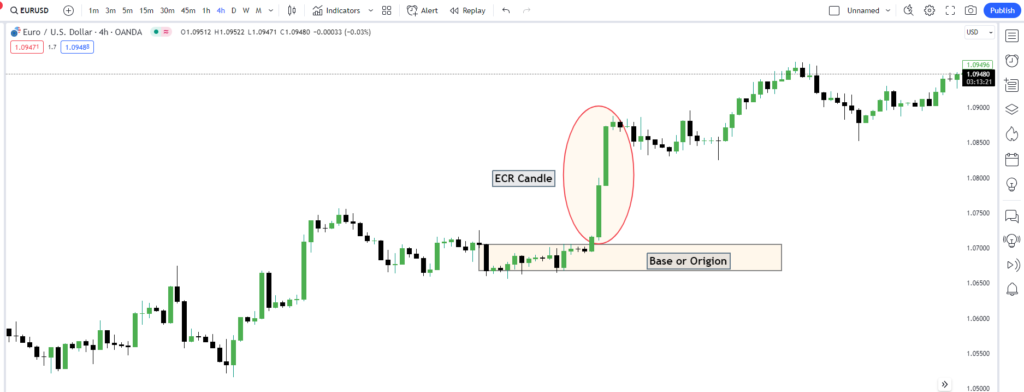
Identifying supply and demand zones involves three steps:
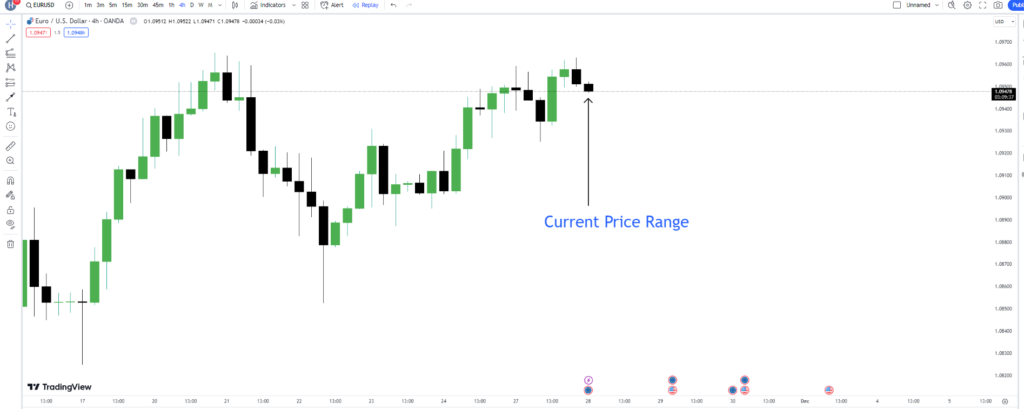
Step 1: Determine Current Price
Begin by identifying the current price level. From this point, look left on the chart until you encounter a significant price movement, either upwards or downwards.
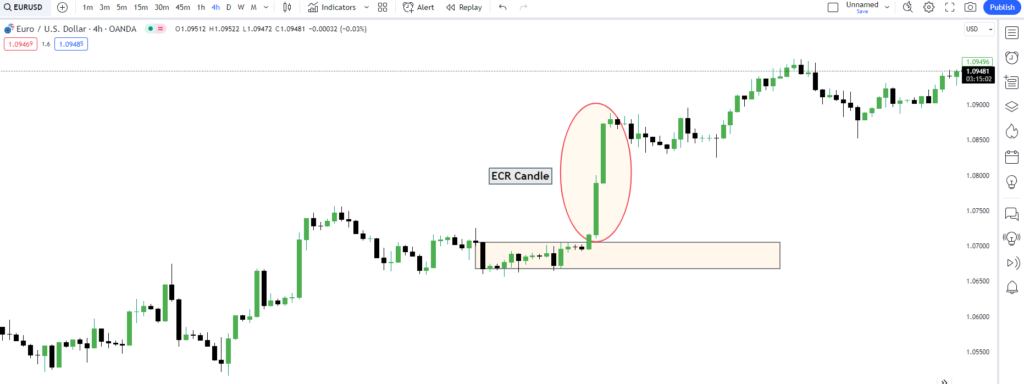
Step 2: Identify Extended-Range Candles (ERCs)
ERCs are strong candlesticks with either short or no wicks. As a general rule, any candlestick whose body occupies more than half of its overall range can be considered an ERC. A minimum of two ERCs is required to indicate a strong move.
Step 3: Locate the Origin of the Big Move
The final step involves tracing back to the zone’s origin. This region represents the formation of the supply or demand zone.
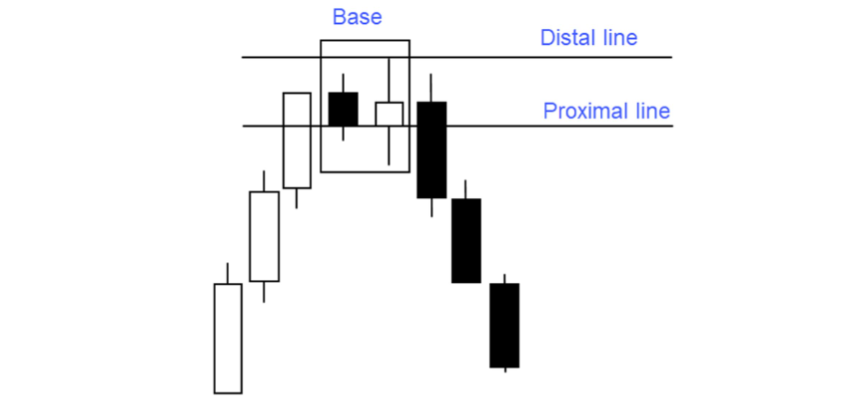
How to Draw Supply and Demand Zone
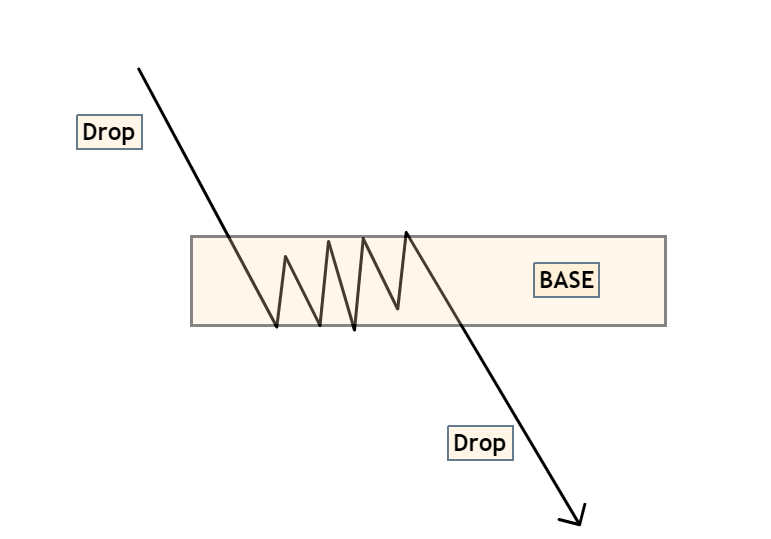
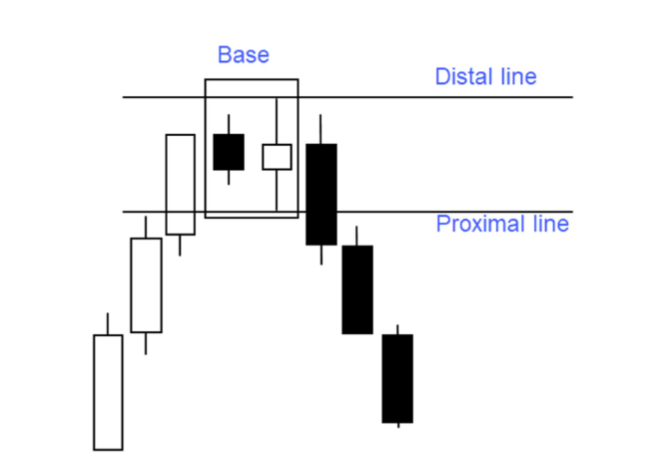
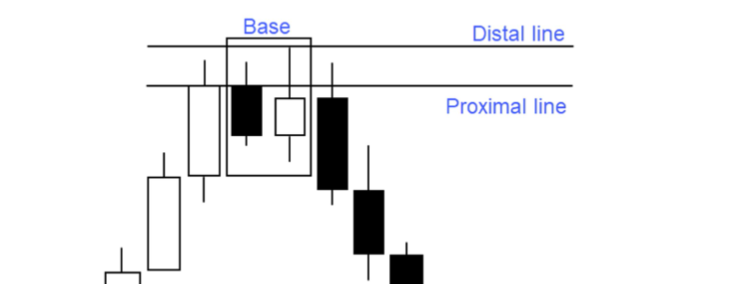
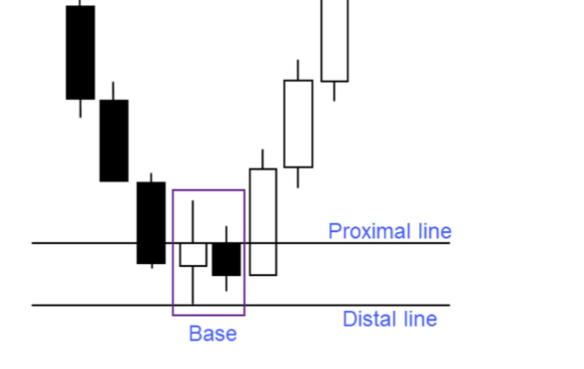
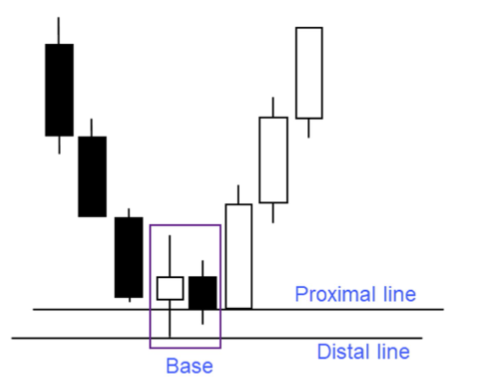
Drawing a supply or demand zone involves identifying two lines around a basing structure, as discussed in the previous chapter. These lines will serve as the basis for determining our entry and stop-loss prices.
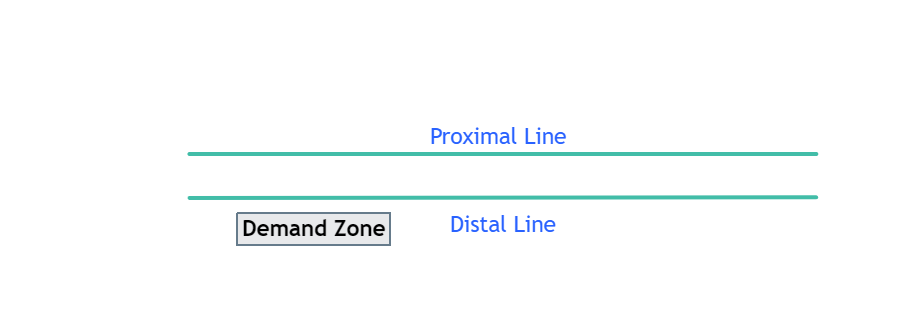
To draw a supply or demand zone, we need two lines: the proximal line and the distal line. These lines define the boundaries of the basing pattern and form the golden area within which we will place our initial entry and stop-loss prices.
The distal line is located at the far end of the zone, while the proximal line is positioned closer to the center of the zone. These two lines are illustrated in the diagram below:
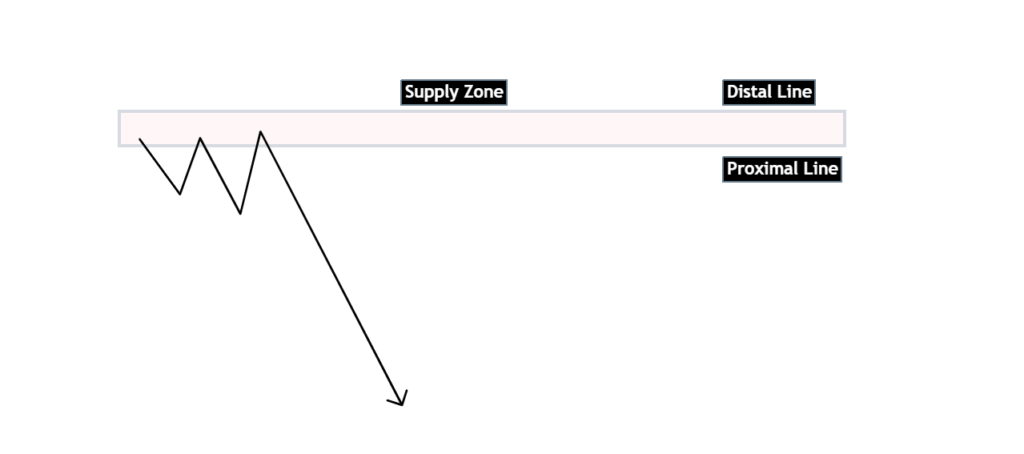
Draw Supply zones
As we learned previously, a supply zone could be in the type of the
- Rally Base Drop(RBD)
- Drop Base Drop (DBD)
1.The medium-risk method
The distal line is located at the highest of the basing structure while the proximal line is placed at the lowest body price of the base.
2.The high-risk method
This method can be preferred by risk-tolerant traders, where the distal line is drawn at the highest price of the base range while the proximal line is at the lowest price of the range.
A clear advantage of this method is your pending order can be triggered earlier, and you can avoid missing some good opportunities when trading.
The low-risk method
This method is more suitable for risk-averse traders. The distal line is placed at the highest price in the base range, and the proximal line is placed at the highest body price in the basing structure.
With this method, your entry price wouldn’t be as good as in other methods, but the loss would be the most comfortable when triggered.
How to draw Demand zones
A demand zone can be in the shape of
- drop-base-rally
- Rally Base Rally
Drawing the supply zone is based on the same principle but the opposite side.
The medium-risk method
In this method, the distal line is placed at the lowest price in the basing structure. Meanwhile, the proximal line is placed at the highest body price in the zone.
The high-risk method
The distal line and the proximal line are placed at two price extremes in the demand zone. This method is preferred by risk-tolerant traders.
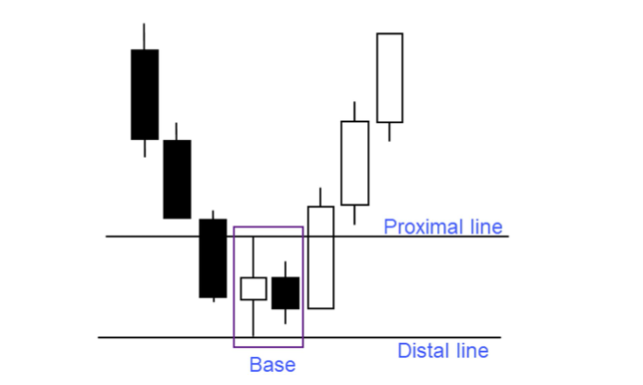
The loss would be the biggest if the stop price is hit, however, traders can have their trades triggered at a better price.
The low-risk method
The distal line is drawn through the lowest price point in the range. Meanwhile, the proximal line is placed at the lowest body price in the basing structure.
- Dark Cloud Cover: A Guide to Trading This Bearish Candlestick Pattern - 26 December 2023
- Title: Piercing the Veil of Market Sentiment: The Piercing Pattern in Trading - 26 December 2023
- Bullish Marubozu: A Comprehensive Guide to Trading with Confidence - 26 December 2023