
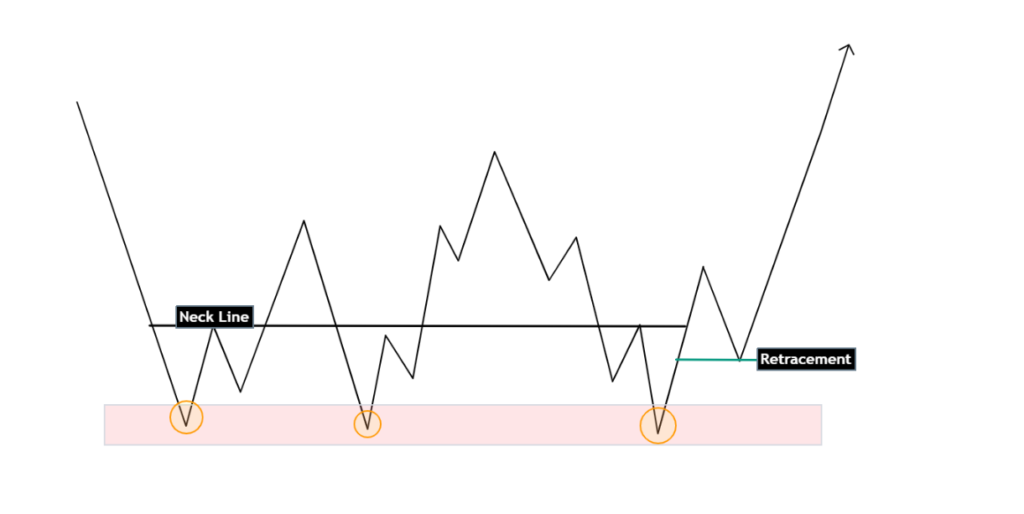
A triple bottom chart pattern is a bullish reversal pattern that indicates a possible change in trend from down to up.
It is formed when the price of a security makes three consecutive lows at approximately the same level and then breaks out above the resistance level created by the previous two highs.
The triple bottom pattern chart is considered to be a strong reversal signal, and it is often followed by a significant uptrend.
characteristics triple bottom chart pattern FX:
- Three consecutive lows at approximately the same level
- A breakout above the resistance level created by the previous two highs
- An increase in trading volume as the price breaks out above resistance
- A confirmation of the reversal signal by a bullish moving average crossover
Traders will often use the triple bottom chart pattern as a signal to buy a security. They may place a buy order above the breakout level, or they may wait for the price to pull back slightly after the breakout before buying.
Learn more about the Bearish Reversal Pattern.
Triple bottom trading strategy in Forex
The triple bottom chart pattern is a bullish reversal formation signaling a potential shift from a downtrend to an uptrend. Traders can employ a systematic approach to capitalize on this pattern.
Here’s a step-by-step trading strategy:
- Identify the triple bottom formation:
Look for three consecutive lows at approximately the same level, separated by periods of consolidation or minor uptrends.
- Wait for the breakout:
Once the price breaks above the resistance level created by the previous two highs, place a buy order. Consider waiting for confirmation, such as a bullish moving average crossover.
- Set a stop-loss order:
Place a stop-loss order below the breakout level to limit losses if the trade doesn’t work out. Trailing the stop-loss as the price moves up can protect profits.
- Take profits:
Exit the trade at your target price or when signs of weakening in the uptrend appear.
Additional Tips for Trading the Triple Bottom Pattern:
- Use other technical indicators: Confirm the signal with additional indicators and identify potential entry and exit points.
- Consider volume confirmation: Look for increased trading volume at the breakout to validate the pattern’s strength.
- Determine a price target: Establish a realistic price target based on the pattern’s height or using tools like Fibonacci extensions.
- Time frame consideration: Analyze the pattern on the timeframe aligning with your trading strategy.
- Backtesting: Test the strategy on historical data to assess its effectiveness under various market conditions.
- Evaluate market conditions: Consider the broader market trend and adapt the strategy accordingly.
- Risk-reward ratio: Ensure that potential profits outweigh potential losses to maintain a positive expectancy.
- Adaptability: Be prepared to adapt the strategy based on evolving market conditions, news events, or other influencing factors.
Pros and Cons Triple bottom candlestick pattern
Pros:
- Strong reversal signal: The triple bottom pattern is a well-recognized and respected technical indicator that is often followed by a significant uptrend.
- Easy to identify: The triple bottom pattern is relatively easy to identify on a chart, making it accessible to traders of all levels of experience.
- Provides clear entry and exit points: The breakout above the resistance level provides a clear entry point for traders, and the subsequent uptrend provides a clear exit point.
Cons:
- Can take time to form: The triple bottom pattern can take time to develop, which can be frustrating for traders who are looking for quick profits.
- Not a guarantee of success: Like all technical indicators, the triple bottom pattern is not a guarantee of success. There is always the possibility that the price will not break out above resistance, or that the uptrend will not be sustained.
- Requires confirmation: The triple bottom pattern should be confirmed by other technical indicators before entering a trade.
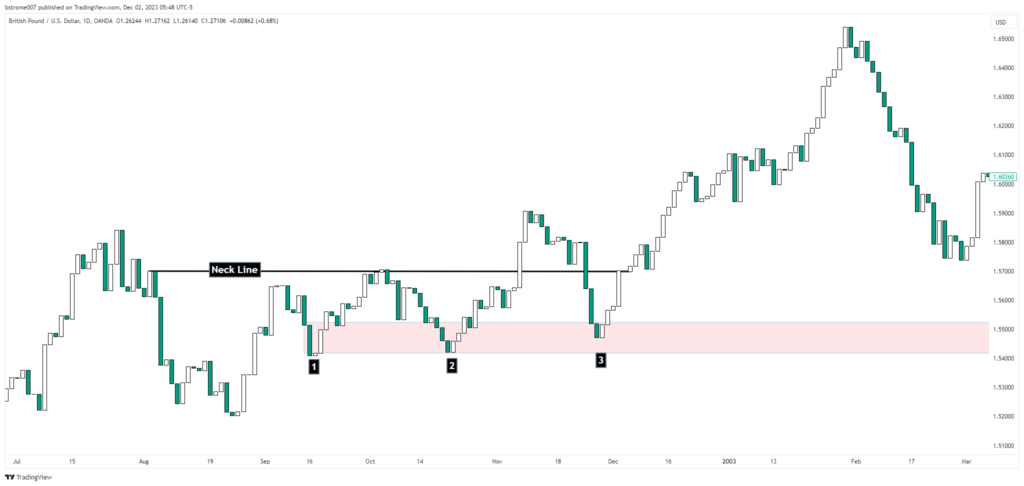
GBPUSD Triple Bottom Example
In the chart below of the GBP/USD currency pair, a triple bottom pattern formed between 16 16 September-2022,27 Nov 2022.
. The breakout above the resistance level on December 3 2022 marked the beginning of an uptrend that continued until 5 Feb 2023. Traders following this strategy could have entered a buy order above the breakout level on 7 December 2022 and taken profits in February 2023.
By combining the triple bottom pattern with these considerations, traders can enhance the robustness of their strategy and navigate the dynamic nature of the financial markets with greater confidence.
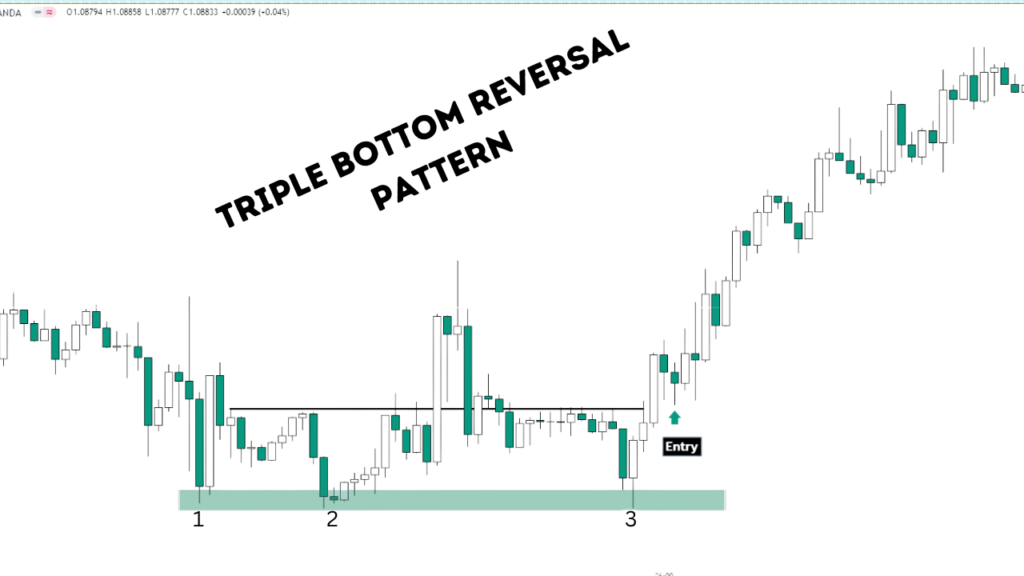
Triple Bottom Chart Example
- Dark Cloud Cover: A Guide to Trading This Bearish Candlestick Pattern - 26 December 2023
- Title: Piercing the Veil of Market Sentiment: The Piercing Pattern in Trading - 26 December 2023
- Bullish Marubozu: A Comprehensive Guide to Trading with Confidence - 26 December 2023