
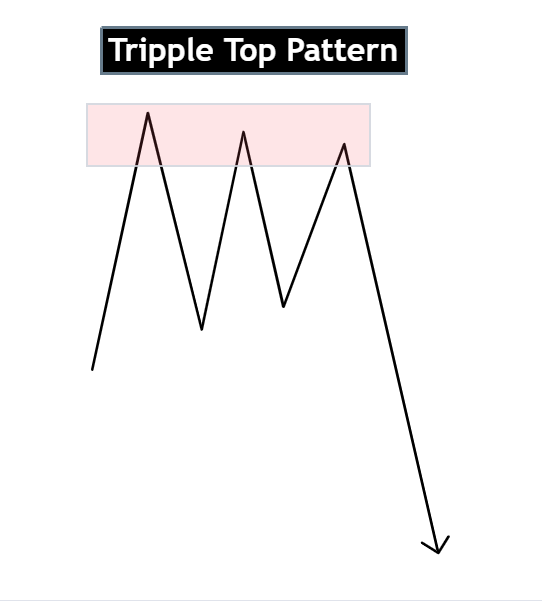
A Triple top is a pattern in stock and Forex analysis that signals a likely drop in a stock’s value.
It happens when the stock price tries three times to go past a certain point but fails each time. After the third attempt, the stock price often goes down.
In this tutorial, we’ll explore the meaning of the Triple Top Chart pattern. We’ll delve into trading strategies and provide examples from the worlds of forex and cryptocurrency to illustrate this specific chart pattern.
meaning of triple top pattern in FX
In foreign exchange (FX), cryptocurrency, and stocks, the Triple Top is regarded as one of the most potent bearish reversal patterns. It emerges when the price attempts to break a certain level for the third time but faces failure, leading to a subsequent downward movement.
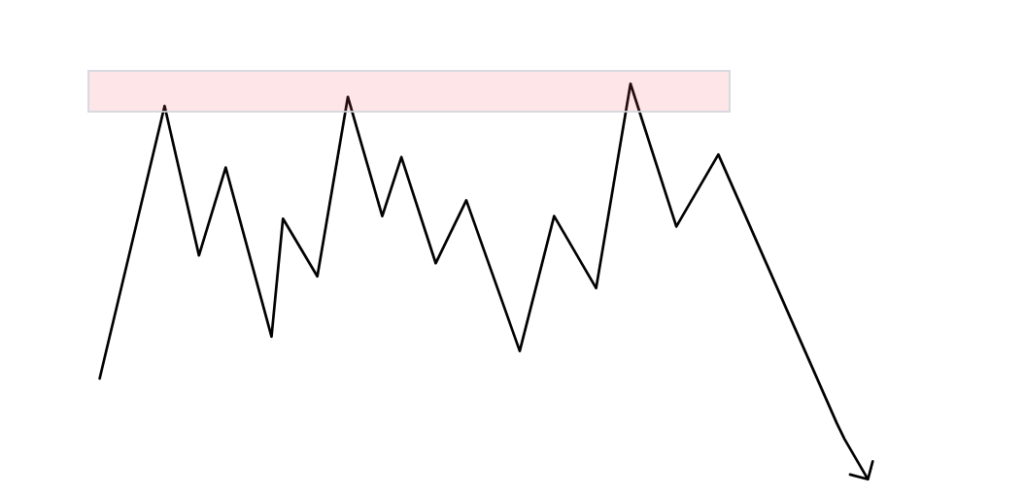
Triple tops chart patterns are considered to be one of the most reliable bearish reversal patterns. They are often preceded by a period of strong upward momentum, which makes them even more significant.
Here are the key characteristics of a triple-top pattern:
- Three consecutive highs at approximately the same price level
- Two troughs between the highs, which are typically at or near the same price level as well
- A decline in the security’s price after the third high breaks below the support level
Trading Strategy
When trading the Triple Top reversal pattern, it’s crucial to adopt the following steps:
- Identification: Clearly recognize the Triple Top chart pattern on the price chart. Look for three consecutive attempts to breach a resistance level, with each attempt followed by a failure.
- Confirmation: Wait for confirmation before making any trading decisions. This may involve observing a decisive price move below the support level following the third failed attempt.
- Volume Analysis: Pay attention to trading volume during the pattern formation. An increase in volume during the third attempt and subsequent breakdown can strengthen the validity of the pattern.
- Entry Point: Consider entering a short position after the confirmed breakdown below the support level. This is typically where traders anticipate the bearish trend to begin.
- Stop Loss: Implement a stop-loss order to manage risk. Place it above the pattern’s highest point or the recent swing high to protect against potential false breakouts.
- Target Price: Estimate a target price for potential profit. This can be determined by measuring the pattern’s height and projecting it downward from the breakout point..
Triple Top pattern example
EURUSD Example of Tripple Top pattern
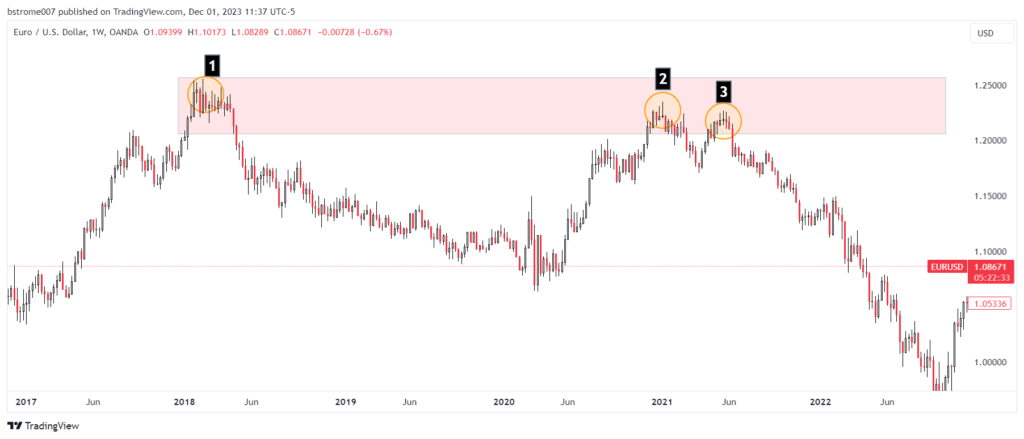
The chart above illustrates a Triple Top reversal pattern on the EURUSD pair, observed on the weekly time frame.
The price attempts to breach the 1.23691 resistance level for the third time but fails. Subsequently, there is a decline in price after the failure.
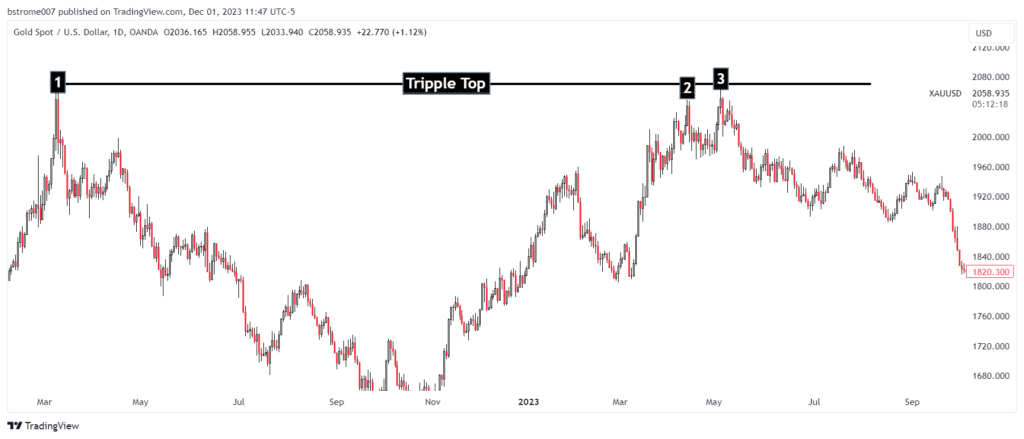
The chart below depicts the Triple Top trading pattern on the XAUUSD (GOLD) pair. The price attempts to break the resistance area of 2066.608, and after the unsuccessful attempt, it moves downward this time.
Is a Triple Top Bullish or Bearish?
The Triple Top pattern is generally recognized as a bearish reversal pattern. It emerges following an uptrend, signaling a potential weakening of the preceding bullish momentum.
This pattern manifests as three peaks, approximately at the same price level, with each attempt to breach a resistance level resulting in failure.
The occurrence of a third failure typically indicates a shift in market sentiment, hinting at a potential downtrend or reversal in the price direction.
Traders commonly interpret the Triple Top as a bearish signal, prompting them to consider short positions or adopt a more cautious trading strategy.
- Dark Cloud Cover: A Guide to Trading This Bearish Candlestick Pattern - 26 December 2023
- Title: Piercing the Veil of Market Sentiment: The Piercing Pattern in Trading - 26 December 2023
- Bullish Marubozu: A Comprehensive Guide to Trading with Confidence - 26 December 2023