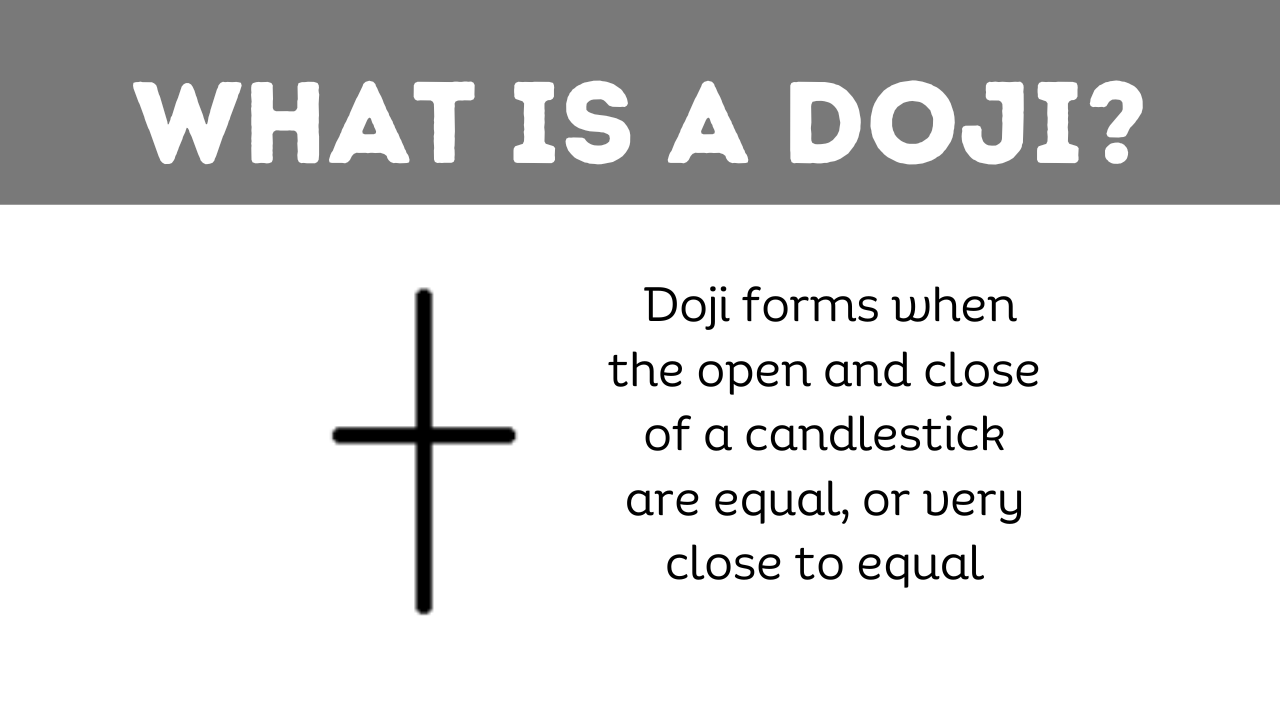
A Doji candlestick pattern is a significant tool in technical analysis, signaling indecision among traders. This pattern is characterized by its unique visual: the opening and closing prices are virtually identical, or very close to each other, resulting in a candlestick that looks like a cross or plus sign.

Anatomy of a Doji Candlestick Pattern
The anatomy of a Doji candlestick is straightforward yet insightful. The almost equal opening and closing prices form a small or nonexistent body. The lengths of the shadows can vary, and these variations lead to different types of Doji patterns, each with its interpretation.
Types of Doji Candlestick Patterns
Standard Doji
A Standard Doji is a basic form where the opening and closing prices are the same. It represents a true equilibrium between buyers and sellers, often indicating a potential reversal in the current trend.
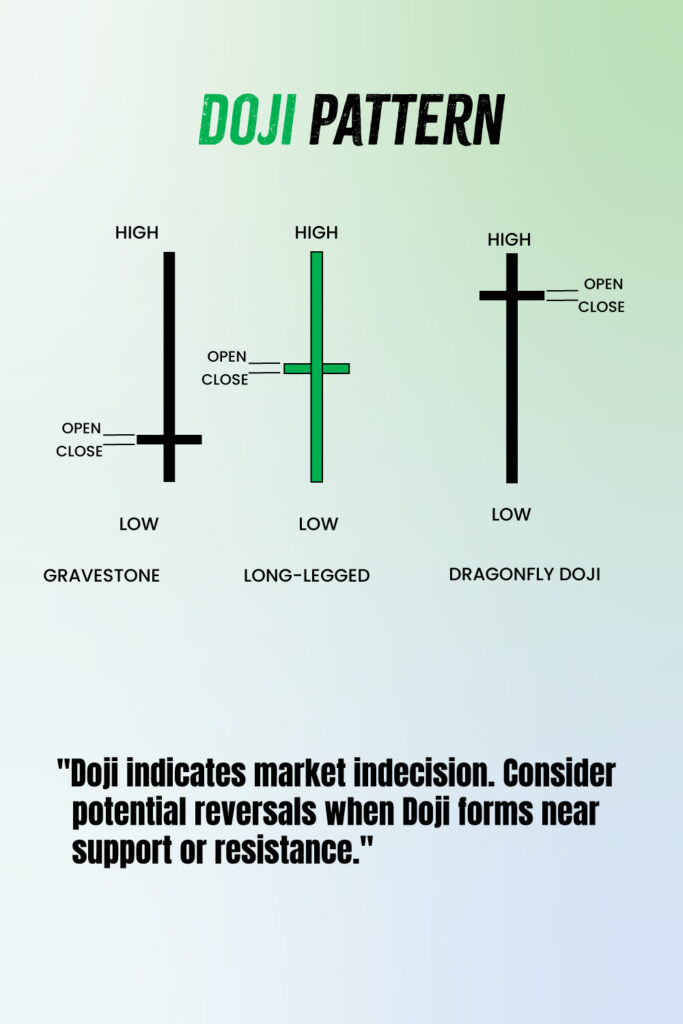
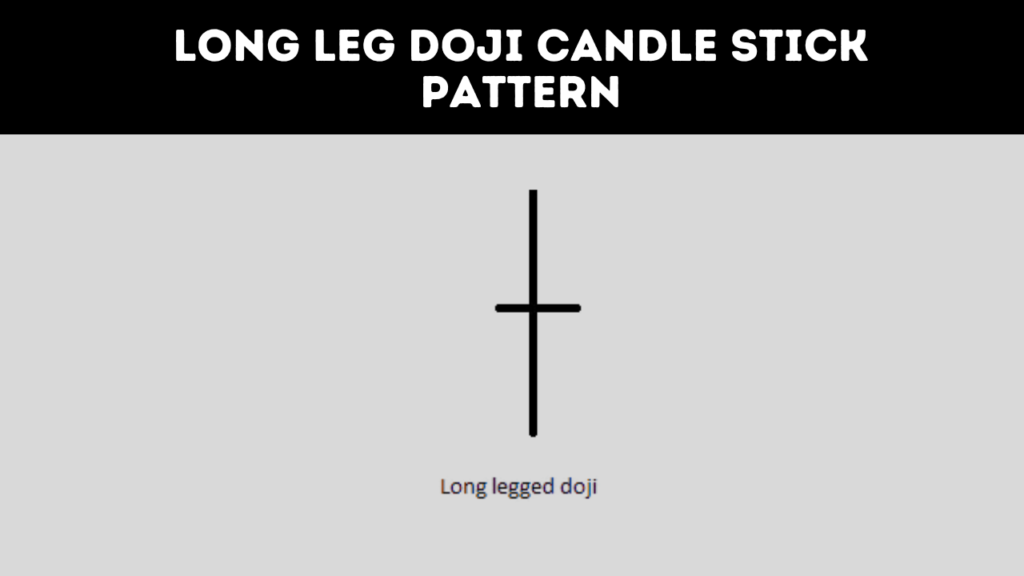
Long-legged Doji
This variation features longer upper and lower shadows, indicating a larger distance between the high and low prices during the trading period. It suggests a significant amount of indecision in the market.
Dragonfly Doji
The Dragonfly Doji has a long lower shadow and no upper shadow, appearing at the bottom of downtrends. It suggests that sellers pushed prices down, but buyers were able to push it back to the opening level, indicating a potential bullish reversal.

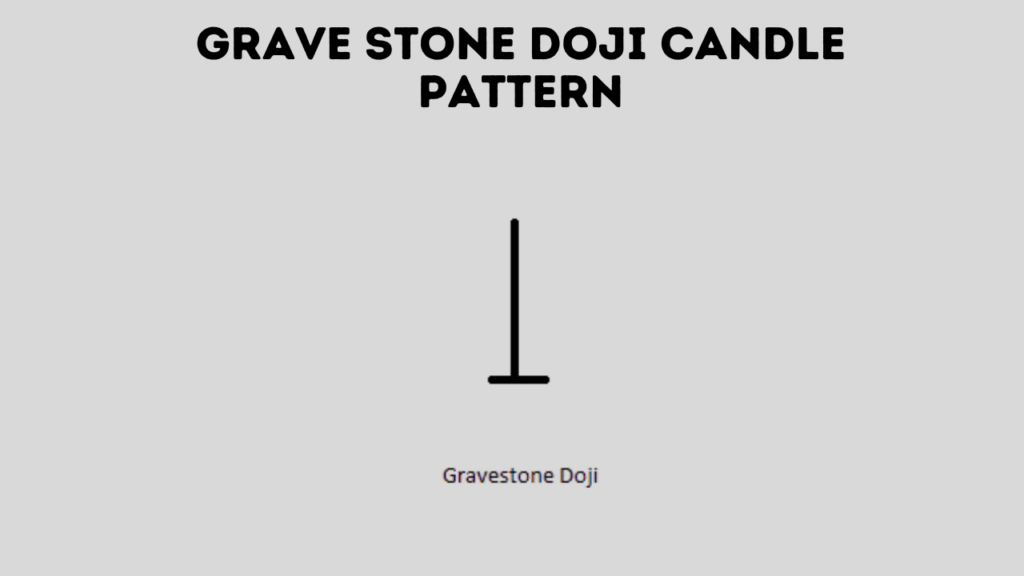
Gravestone Doji
Opposite of the Dragonfly, the Gravestone Doji has a long upper shadow and no lower shadow. This pattern typically appears at the top of uptrends, signaling that buyers pushed the price up, but sellers managed to bring it back down to the opening level, hinting at a bearish reversal.
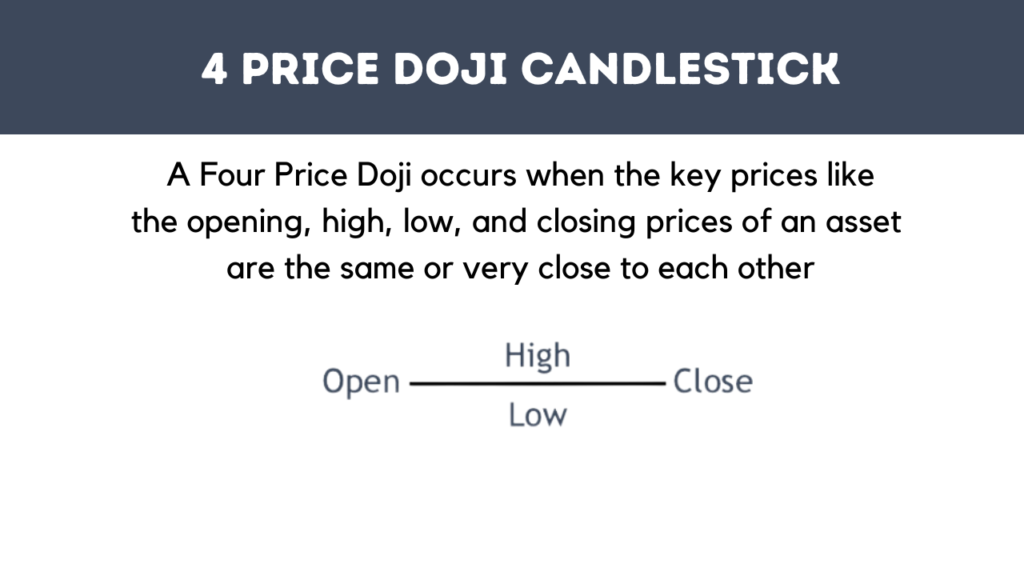
4 price doji candlestick
Price Doji is a rare occurrence where the opening, closing, high, and low prices are all the same, showing extreme indecision in the market.
How to Trade Doji Candlestick Patterns
Trading Doji patterns involves looking for confirmation. For instance, a Doji after an uptrend may signal a reversal, but traders should look for a bearish candlestick to confirm this. Similarly, a Doji after a downtrend may suggest a bullish reversal, but it’s prudent to wait for a confirming bullish candlestick.
Complete Trading Strategy for Doji Patterns
A comprehensive trading strategy for Doji patterns includes:
- Identifying the Pattern: Recognize a Doji pattern within the context of the previous trend.
- Confirmation: Wait for the next candlestick for confirmation of trend reversal.
- Volume Analysis: Look at trading volume for additional confirmation. A high volume during the formation of a Doji may strengthen the signal.
- Setting Stop-Loss Orders: Place stop-loss orders to manage risk effectively. For example, in a bullish reversal, set a stop-loss below the low of the Doji.
- Take-Profit Levels: Determine take-profit levels based on previous support and resistance levels or using a risk-reward ratio.
Conclusion
The Doji candlestick pattern is a powerful tool in a trader’s arsenal, providing insights into market sentiment. Understanding its various forms and incorporating them into a broader trading strategy can help traders make more informed decisions. However, like all trading tools, Doji patterns should be used with other indicators and analysis methods to validate their signals.
- Dark Cloud Cover: A Guide to Trading This Bearish Candlestick Pattern - 26 December 2023
- Title: Piercing the Veil of Market Sentiment: The Piercing Pattern in Trading - 26 December 2023
- Bullish Marubozu: A Comprehensive Guide to Trading with Confidence - 26 December 2023